December
Amazon S3 Data Source
Today we are thrilled to announce Propel’s Amazon S3 Data Source connector. The Amazon S3 Data Source enables you to power your customer-facing analytics from Parquet files in your Amazon S3 bucket. Whether you have a Data Lake in Amazon S3, are landing Parquet files in Amazon S3 as part of your data pipeline or event-driven architecture, or are extracting data using services like Airbyte or Fivetran, you can now define Metrics and query their data blazingly fast via Propel’s GraphQL API.Read the blog post: Introducing the Amazon S3 Data Source: Power customer-facing analytics from Parquet files in your S3 bucket.November
Propellers
Today, we are thrilled to introduce Propellers, an easy way for product development teams to select the optimal cost and query speed for their customer-facing analytics use cases.Propellers are the unit of compute in Propel. The larger the Propeller, the faster the queries and the higher the cost. Every Propel Application (and therefore every set of API credentials) has a Propeller that determines the speed and cost of queries.Read the blog post: Introducing Propellers: Easily select the optimal cost and query speed for each use caseJuly
🔐 Application scopes
Application scopes allow your client- or server-side app to access Propel resources. We’re now offering you greater control in restricting what an Application can or cannot do on your app’s behalf with OAuth 2.0 scopes.Your app can request the following scopes:- admin — The Application has read/write access to Data Sources, Data Pools, and Metrics within its Environment.
- metric:query — The Application can query Metrics within its Environment.
- metric:stats — The Application can query Metrics’ Dimension Statistics within its Environment.
curl to generate an access token with only the “metric:query” and “metric:stats” scopes. This ensures the generated access token can only query Metrics and Dimension Statistics, perfect for securing customer-facing apps.New Metric Types: MIN, MAX and AVERAGE
Business Metrics are based on aggregate data analysis. In some cases, you want to sum revenue for example. In other cases, you want to count the number of requests or count unique visitors for a given time range. In addition to Sum, Count, and Count Distinct Metric types, you can now define Min, Max and Average Metric types.- Min - Selects the minimum value of the specified column for every record that matches the Metric Filters. For time series, it will select the minimum value for each time granularity.
- Max - Selects the maximum value of the specified column for every record that matches the Metric Filters. For time series, it will select the maximum value for each time granularity.
- Average - Averages the values of the specified column for every record that matches the Metric Filters. For time series, it will average the values for each time granularity.
Improvements and fixes
- You can now reconnect a Data Source if a connection failed.
- You can now introspect tables in a Data Source to get the latest tables and schemas.
- You can now see the query activity on the Metric detail page.
- The Dashboard now shows top queries by Applications and Metrics.
- You can now see the unique values for a Metric Dimension.
June
Data Pool sync activity
When syncing a data warehouse table to a Data Pool, you can now see the detailed Sync activity giving you complete operational visibility if something fails. For every Sync, you can see its status, whether it succeeded or failed, when it started, how many records were added, if there were any invalid records, and how long it took.New query type: Leaderboard
In addition to counters and time series, we now support leaderboard queries. Leaderboards are great for visualizing the “top N” of something, such as “the top 10 salespeople of the month” or “the top 100 events last year.” You can query it with atimeRange set of
dimensions to group on, a sort order, filters, and a lowLimit. For example,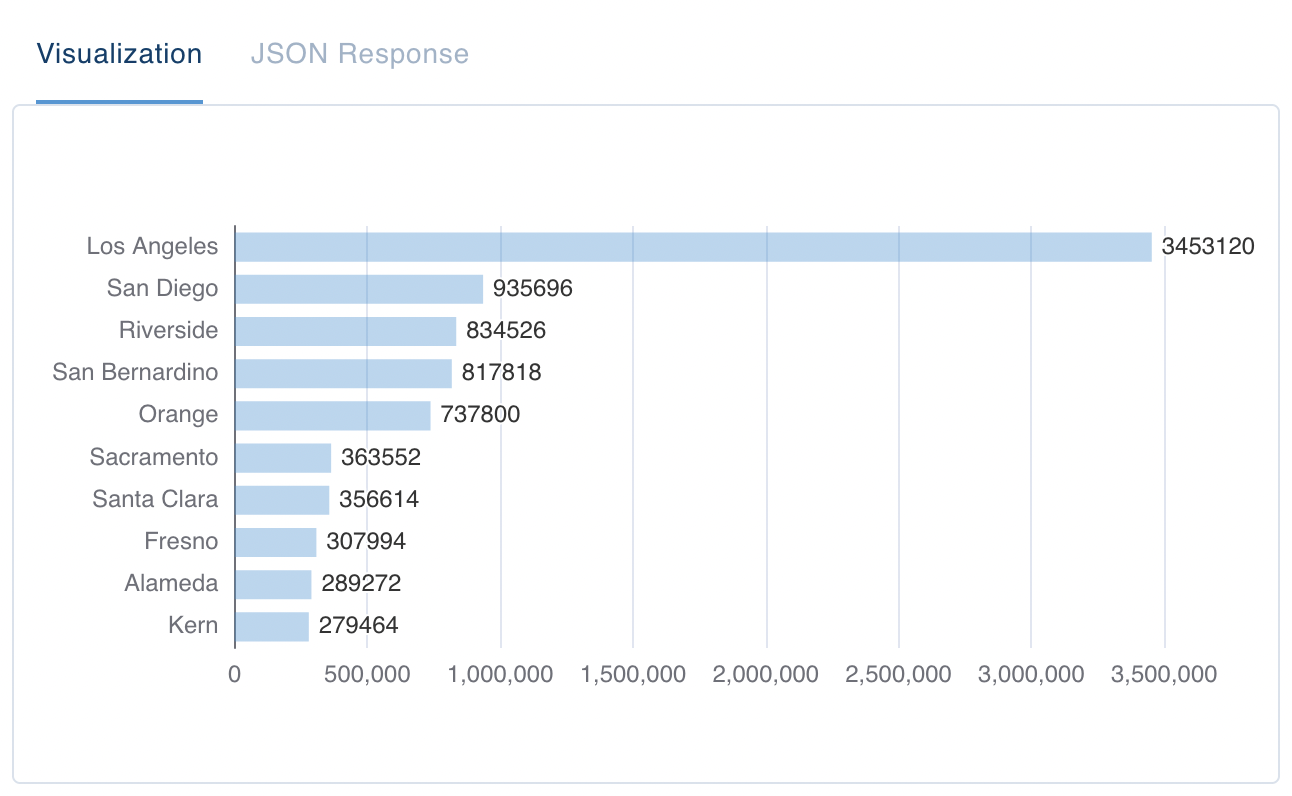 A screenshot of a leaderboard visualization. Rows are labeled with areas from the state of California and are sorted in descending order.
Metric filters
Sometimes you need to define Metrics with a subset of the data you have. For example, if you have a Metric like revenue, you’ll want to exclude all sales records where the type is “PROMOTION” or “TRIAL”.You can now define Metrics with a subset of records of a Data Pool. When defining a Metric via the Console or API, you can create Metric Filters to include or exclude records from the Metric values. See below for an example where we define a Metric to sum up records where “AREA” equals “California”.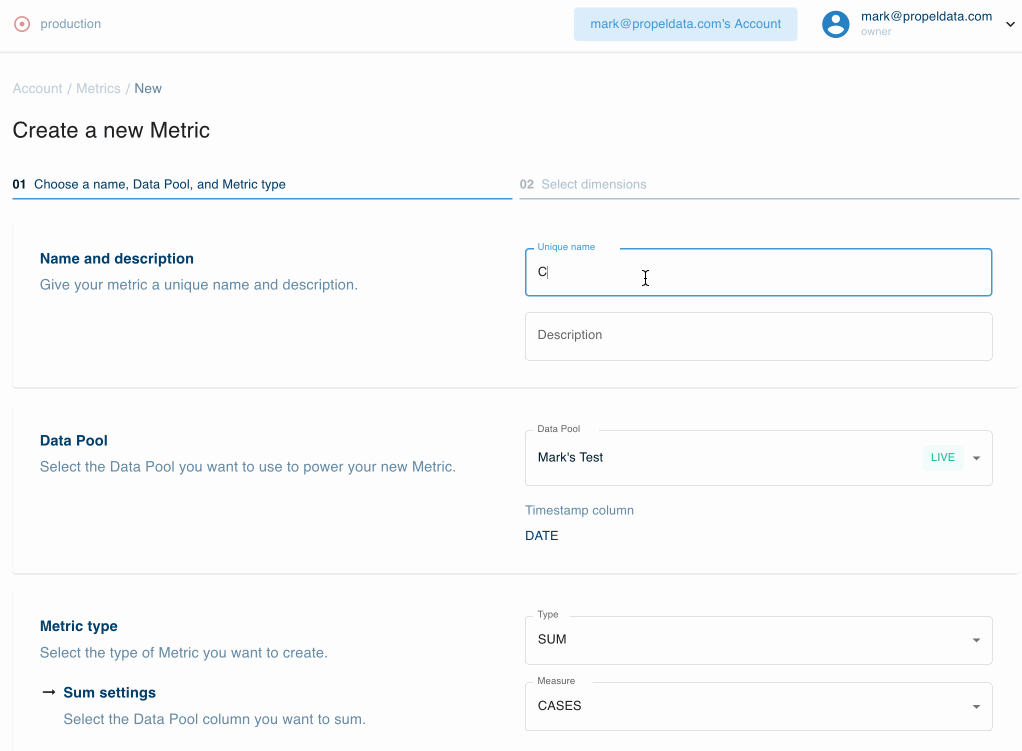 An animated screen capture of the Propel console, showing how to use Metric Filters to select a subset of records from a Data Pool.