December
1️⃣ Amazon Data Firehose ingestion
Ingest data from Amazon Firehose streams into Propel’s Serverless ClickHouse with zero configuration.- Zero-code setup with just a few clicks
- Real-time ingestion without batch jobs
- Automatic JSON flattening and column mapping
- Built-in authentication for Firehose integration
2️⃣ Time Range Picker UI component
A customizable React component for selecting dashboard time ranges, with seamless Propel Query API integration.- Relative and absolute time ranges
- Date-to-now selections
- Custom time period options
- Themeable UI
3️⃣ Segment event ingestion
Stream Segment events directly to Propel for real-time analytics.- Real-time event processing
- Automatic JSON property flattening
- Batch and individual event support
- Real-time transformations
4️⃣ Data Grid UI component
The Data Grid is a React component for easily visualizing data in a table format.Features you no longer need to build:- Built-in pagination
- Ordering and filtering
- Automatic column name formatting
- Built-in drawer for displaying row or JSON values
- Fully themable and customizable
5️⃣ DynamoDB → Propel’s ClickHouse
DynamoDB excels as a transactional database, but it’s not ideal for analytics involving aggregations and GROUP BY queries.That’s where Propel’s DynamoDB connector shines. It allows you to replicate DynamoDB data in real time to Propel’s Serverless ClickHouse, enabling advanced analytics that are both fast and cost-effective.Key features:- Seamless integration with DynamoDB streams
- Real-time replication of inserts, updates, and deletes
- No infrastructure management needed
- No need to pay for expensive ETL tools ❤️
November
Improvements and fixes
Management API
- Added CREATE, MODIFY and GET Environment operations to the Management API with new ENVIRONMENT_ADMIN scope
- Added Delete Environment mutation
- Improved hardening of the Copy Job functionality
Serverless ClickHouse
-
Added support for SHOW commands including:
SHOW DATABASESSHOW TABLESSHOW COLUMNSSHOW INDEXESSHOW CREATE DATABASESHOW CREATE TABLESHOW FUNCTIONSSHOW ENGINES
-
Added support for system tables including:
system.databasessystem.tablessystem.columnssystem.aggregate_function_combinatorssystem.formatssystem.functionssystem.licensessystem.settingssystem.settings_changedsystem.table_enginessystem.table_functionssystem.time_zones
-
Improved PopSQL compatibility:
- Switch to
date_time_output_format = 'simple'when Faraday user agent is detected - Added support for HTTP GET requests with queries in body
- Switch to
-
Enhanced timezone handling:
- Added timezone parameters to Propel functions
- Improved timezone management for Time Series API date/time boundaries
- Fixed bug where tables were added without “propel” database qualifier
-
Changed
currentDatabase()to return “propel” - Added support for database query parameter and x-clickhouse-database header
-
Added support for
wait_end_of_queryparameter used by Python clients - Improved authentication handling for missing X-ClickHouse-Key header
- Added support for client_protocol_version in ClickHouse HTTP endpoint
Console
- Introduced new DataGrid component for Preview Data and SQL console
- Moved ClickHouse Data Pools to Federated tables section
October
1️⃣ ClickHouse SQL interface
We’ve launched a native ClickHouse SQL HTTP interface that lets you query Propel’s Serverless ClickHouse directly. You can use any standard ClickHouse library or SDK to runSELECT and SHOW queries against your data.To get started, use the following connection details:| Parameter | Value |
|---|---|
| Host | https://clickhouse.us-east-2.propeldata.com |
| Port | 8443 |
| Database | propel |
| user | Your Propel Application ID |
| password | Your Propel Application secret |
2️⃣ New docs
We’ve completely revamped our documentation to make it easier for developers to get started and be successful with Propel.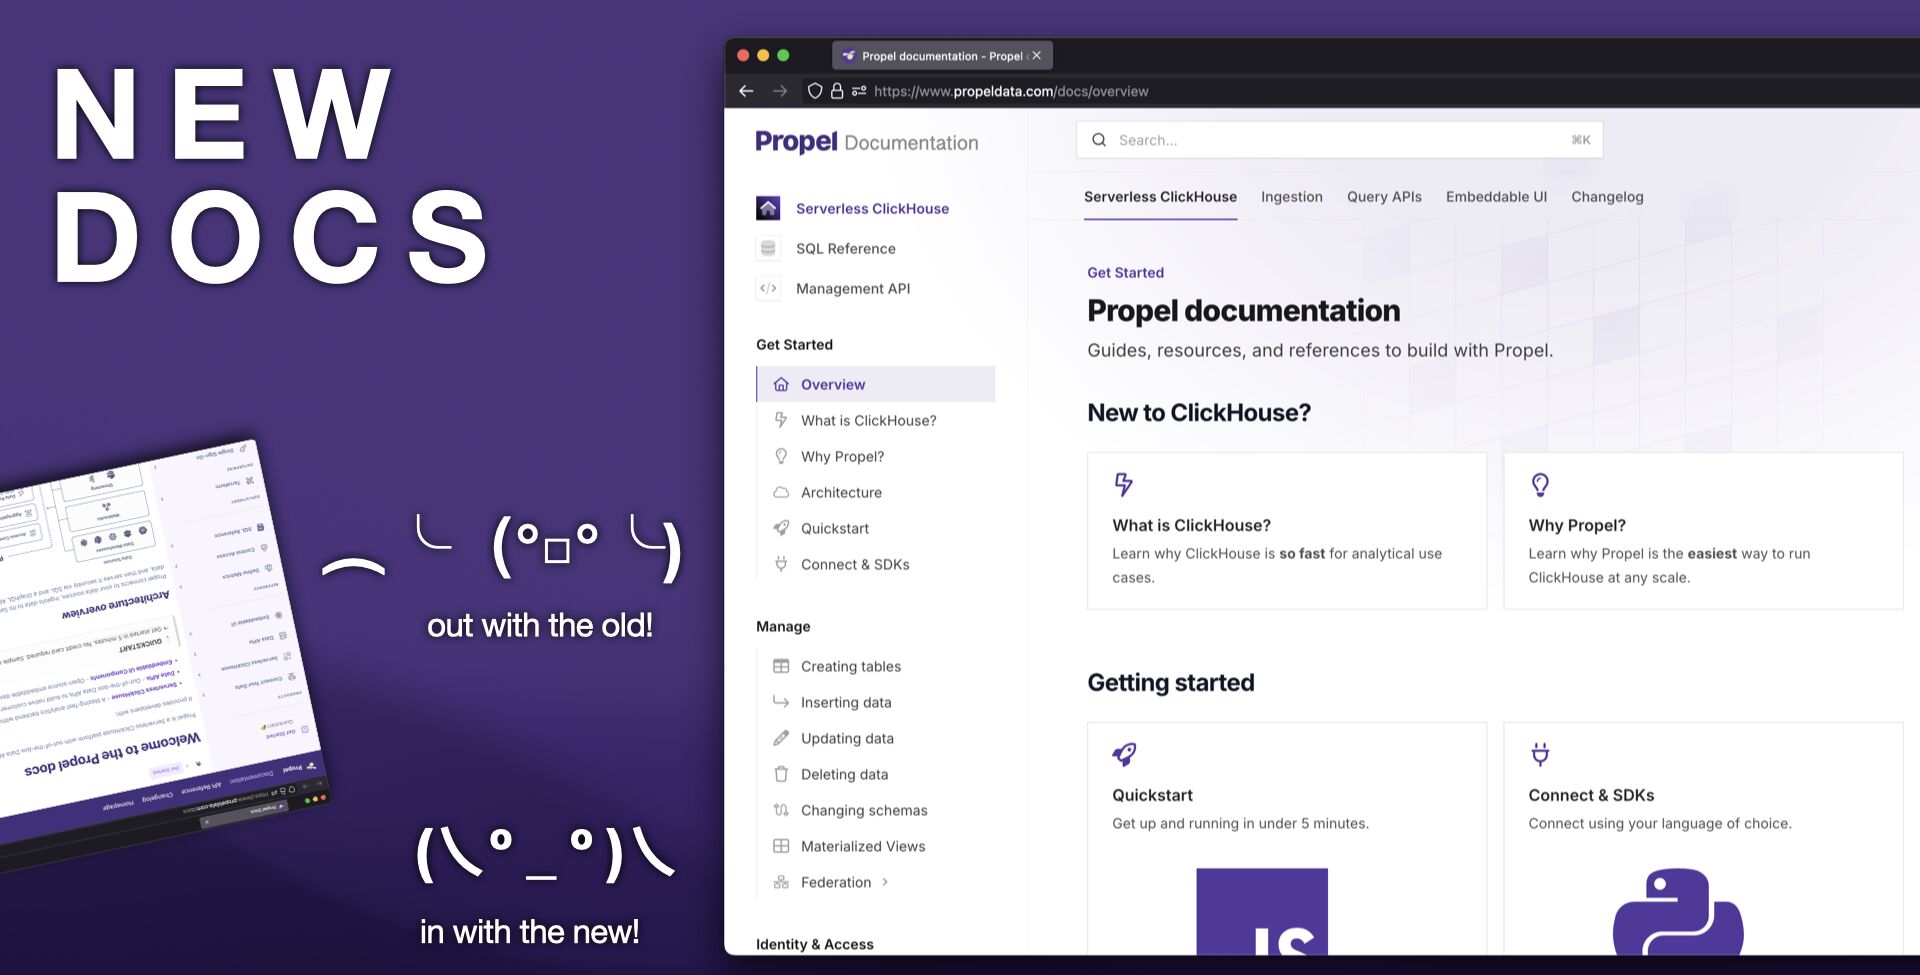
- Serverless ClickHouse: Connection details, supported SQL syntax, SQL reference, functions, and everything you need to know to manage, transform and query your data.
- Ingestion: Guides on ingesting data from a variety of sources to Propel, including Webhooks, events streams, and data warehouses.
- Query APIs: Guides and examples for using the SQL and Query APIs for common analytics use cases and data visualizations.
- Embeddable UIs: Guides and documentation for embedding Propel’s visualization components into your applications.
3️⃣ Server-side authentication
You can now authenticate server-side applications using HTTP Basic Authentication with your Application ID and secret.4️⃣ New GroupBy UI component
The<GroupBy> component is a dropdown menu that allows users to dynamically change the grouping of data for multidimensional analysis.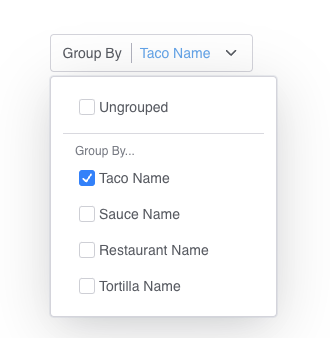
<GroupBy> component.Improvements and fixes
Serverless ClickHouse
- Added support for authentication using
X-ClickHouse-UserandX-ClickHouse-Keyheaders. - Fixed issues with Materialized Views and Copy Jobs that contain common table expressions (CTEs).
Ingestion
- Fixed an issue that ocassionally prevented Webhook syncs from progressing beyond the
PENDINGstate.
Console
- Fixed issue with GitHub login authentication.
- Added new Console start page and insights section.
- For SSO-enabled accounts, the “Invite Users” button is now disabled and displays a message explaining that user management must be done through the SSO provider.
- Added ability to modify the default timestamp column in Data Pools.
- Added SQL dialect selector to the SQL Console, allowing users to switch between ClickHouse and PostgreSQL syntax
API
- Exposed the SQL dialect in the SQL API.
- Fixed a case where the Metric Report API was not returning correct results.
Embeddable UI
- Fixed type definitions for
chartConfigPropsin the<TimeSeries>component. - Removed unintended Storybook environment variable exports.
- Added
groupByfunctionality to<TimeSeries>and<FilterProvider>components for dynamic data grouping. - Standardized border radius styling across all components.
- Updated
<Leaderboard>component to properly sync with time range from<FilterProvider>. - Corrected type definition for
legendPositionprop in<PieChart>component. - Added customizable
accentColorsprop to<Leaderboard>component for visual styling.
September
Improvements
Ingestion
- Improved Webhook Data Pool performance: Increased request per second (RPS) and concurrent request capacity 4x, significantly reducing 429 responses.
- The Webhook Data Pool now accepts payloads up to 1 MiB.
Console
- Enhanced account security: Users can now set up Multi-Factor Authentication (MFA) for their accounts.
- Improved user experience: The last selected Propeller for the Data Pool’s Preview Data will be remembered and displayed for future sessions.
- Updated console for deprecated API Scope: Applications without prior access to
DATA_POOL_READ,DATA_POOL_STATS,METRIC_READ, andMETRIC_STATSscopes will no longer be able to set these scopes as they are now deprecated
API
- Deprecated
DATA_POOL_READ,DATA_POOL_STATS,METRIC_READ, andMETRIC_STATSAPI scopes. - Expanded
DATA_POOL_QUERY,METRIC_QUERYAPI scopes to allow seeing the schema for the Data Pools and columns they have access to. - Improved the resiliency of copy jobs for large tables, reducing errors and preventing jobs from getting stuck. Enhanced error messages to provide more informative feedback when jobs fail.
- Propellers no longer have a limit on maximum bytes to read making them more powerful.
- Materialize View creation now tests the SQL query prior to creating the Materialized View. This protects developers from creating Materialized Views with incorrect SQL. I handles the case when queries take a long time for large datasets gracefully.
SQL
- Enhanced JOIN clause functionality:
- Added support for multiple column expressions using
ANDandORoperators - Expanded operator support beyond
=to include>,<,LIKE, andINamong others.
- Added support for multiple column expressions using
- Increased query result size limit from 500KB to 10MB, allowing for larger data retrieval
- New ClickHouse functions for enhanced string manipulation and searching:
- Position and Search functions like:-
position,locate,positionCaseInsensitive,positionUTF8,positionCaseInsensitiveUTF8- multiSearch functions for various use cases (e.g.,AllPositions,FirstPosition,FirstIndex) - Pattern Matching:-
match,REGEXP,multiMatchAny,multiMatchAnyIndex,multiMatchAllIndices- Fuzzy matching:multiFuzzyMatchAny,multiFuzzyMatchAnyIndex,multiFuzzyMatchAllIndices - Extraction and Comparison:-
extract,extractAll,extractAllGroupsHorizontal,extractAllGroupsVertical-like,notLike,ilike,notILikefunctions - N-gram and Substring Operations:-
ngramDistance,ngramSearch(with case-sensitive and UTF8 variants)-countSubstrings,countMatches(with case-insensitive options) - Specialized String Functions:-
regexpExtract,hasSubsequence,hasToken(with various options for case sensitivity and UTF8)
- Position and Search functions like:-
Embeddable UI (0.11.1)
- New layout components:
<Container>,<Flex>,<Grid>, and<Card>. - New typography components:
<Text>and<Heading>. - New
<Tabs>component for tab-based layouts with support for Card components as tabs. - Added importable theme colors: Users can now import specific colors (e.g.,
gray) from"@propeldata/ui-kit/colors"for consistent styling across the application. <TimeRangePicker>now integrates seamlessly with<FilterProvider>for improved data filtering across components.- Added new
<TimeGrainPicker>component that also integrated seamlessly with the<FilterProvider>. - Improved React compatibility: All components are now compatible with React Server Components (RSC) and exported as client-side components, enhancing performance and flexibility.
- Enhanced debugging capabilities: Components now log prop mismatch errors, facilitating easier troubleshooting and development.
- Added
groupByfunctionality to the<TimeSeries>component, enabling data grouping and more flexible visualizations. - Enhanced the
<SimpleFilter>component with clearable functionality. Developers can use thedisableClearableprop to turn off this feature if needed. - Improved color customization: Replaced
accentColorwithaccentColorsto provide more versatile theming options.
Terraform (v1.3.4)
- Enhanced flexibility in Data Pool configuration: Added support for explicitly setting empty values for
partition_by,order_by, andprimary_keyfields. Users can now use the syntax[""]to define these fields as empty when needed. This improvement allows for more precise control over Data Pool settings.
Fixes
Console
- Resolved issues with Google sign-in for accepting invitations.
- Fixed a bug that prevented sign-ups for users who had previously registered but not verified their email.
- Fixed a bug that caused the SQL Console to attempt to send a Propeller for Applications resulting in an error.
API
- The API now returns a
NOT_FOUNDerror when the requested resource doesn’t exist. This applies to Materialized Views, Copy Jobs, and Data Pool access policies, improving error handling and user experience.
Embeddable UI
- Fixed inconsistent border radius across components for improved visual coherence.
- Aligned
<SimpleFilter>component styles with select-based components like the<TimeRangePicker>for a more uniform user interface.
Terraform (v1.3.4)
- Fixed an issue where
order_by,partition_by, andprimary_keycolumns were being applied in an incorrect order when defining Table Settings during Data Pool creation. We replacedSetwithListto ensure order is preserved in fields where it’s critical.
August
Improvements
Console
- Developers can now sign up and sign in using their Google account.
- Developers can now sign up and sign in using their GitHub account.
SQL
- Enhanced support for ClickHouse and PostgreSQL array functions.
- Introduced new ClickHouse SQL functions:
arrayJoin: Allows for the expansion of arrays into separate rows.JSONExtractArrayRaw: Extracts an array from a JSON string.JSONExtractKeys: Retrieves keys from a JSON object.JSONArrayLength: Determines the length of a JSON array.
- Added ClickHouse tuple manipulation functions:
tupleNames: Returns the names of tuple elements.tupleElement: Extracts a specific element from a tuple.
- Added ClickHouse geospatial functions for advanced geographical data processing.
July
New Features
Up to 47% price reduction for your queries
Our most powerful Propellers, the P1_LARGE and P1_X_LARGE, which can read 250 and 500 million rows per second respectively, now have a significantly lower price.| Propeller | Old price | New price | % Price drop |
|---|---|---|---|
| P1_MEDIUM | $0.10 per GB read | $0.06 per GB read | 40% |
| P1_LARGE | $0.12 per GB read | $0.07 per GB read | 42% |
| P1_X_LARGE | $0.15 per GB read | $0.08 per GB read | 47% |
User management in Console
Customers can now invite their team members to their Propel account. This feature enhances collaboration by allowing multiple users to access and work on the same account. Team members can share resources, manage Data Pools, and streamline their workflows within a single, unified account.Log in and invite your teammates.Fixes
Console
- SQL Playground will not show an error when the query is missing a
FROMstatement. - We fixed an issue where the Snowflake Data Pool creation flow was incorrectly sending
verparam for MergeTree tables, causing creation to fail. - Customers will not see cached tables after running an introspection on any data source.
Ingestion
- We fixed an issue with new Snowflake Data Pools on ReplacingMergeTree that were not supporting Re-sync functionality, the
FINALclause was not being correctly added to the underlying ClickHouse queries, and_propel_is_deletedfiltering wasn’t working in some cases.
API
- We fixed an issue when creating and modifying Applications that was not allowing nullable values for the unique name and description fields. Now unique name and description fields are optional as defined in the GraphQL schema.
Improvements
Console
- The SQL Console and Materialized View creation flow now supports formatting the current query.
- When creating a Materialized View with an existing Data Pool, developers will only see Data Pools with a compatible schema.
- Customers will be able to enable/disable access control on Snowflake Data Pool creation.
- You can now copy Metric name and ID from the Metric list page.
Terraform
- Developers can now manage (create, delete, update) Applications via Terraform.
June
Materialized Views
We’re introducing Materialized Views in Propel’s Serverless ClickHouse as a powerful tool for data transformation. Developers can leverage Materialized Views to reshape, filter, or enrich data with SQL. Materialized Views are persistent query results that update dynamically as the original data changes.The key benefit? Data is transformed in real time. No scheduling. No full-refreshes. Learn more about Materialized Views
Rockset Migration Service
OpenAI has announced the acquisition of Rockset, and as a result, the Rockset service will cease to operate. For those unfamiliar with Rockset, it was a cloud-hosted real-time analytics database that enabled millisecond-latency queries for aggregations and joins, similar to Propel.We are pleased to announce the immediate availability of the Rockset Migration Service. This service is designed to offer a seamless transition for companies from Rockset.To get started with the migration process, please schedule a kick-off call with our team here.
Customizable Table Engine and Sorting Key for all Data Pools
We are thrilled to announce that Propel now supports customizable table engines and sorting keys for all Data Pools. What does this mean? Better query performance, more cost-efficient reads, and support for real-time updates and delete on any Data Pool type.Table engines in Propel’s Serverless ClickHouse determine how tables store, process, read, and update their data.The sorting key is a set of one or more columns that Propel uses to organize the rows within a table. It determines the order of the rows in the table and significantly impacts the query performance. If the rows are sorted well, Propel can efficiently skip over unneeded rows and thus optimize query performance.This enhancement provides users with more flexibility and control over their data, allowing them to optimize their data pools for their specific use cases. Learn more about the table engine and sorting key
Fixes
Console
- The “Operations” tab for all Data Pool types.
- All Data Pool types can now have a customizable Propeller in the “Preview Data” section.
Improvements
Terraform
- The resource for Kafka Data Pools is now available.
- The resource for ClickHouse Data Pools is now available.
- The resource for Materialized View is now available.
- The Data Pool resource now supports table settings.
- The Unique ID field is now deprecated in the Data Pool resource.
- The Tenant ID field is now deprecated in the Data Pool resource.
- The timestamp field is now Optional in the Data Pool terraform.
API
- The API ADMIN scope is sufficient for Applications to get and list other Applications, but it does not allow them to fetch other Application secrets. This simplifies Terraforming of Data Pool Access Policies, which previously failed when the Terraform Application had only ADMIN scope.
- The ClickHouse Data Source API is now public.
- You can now modify the
timestampfield in the Data Pool API. - The
uniqueIdandtenantIdfields are now deprecated in the Webhook Connection Settings object
May
New Features
Expanded SQL function support
We have significantly expanded our SQL function support, extending it to a broad range of functions for PostgreSQL and ClickHouse SQL dialects, as well as unique Propel functions. This improvement offers developers greater flexibility and control when querying, transforming, and managing data.Learn more about Propel SQL function support.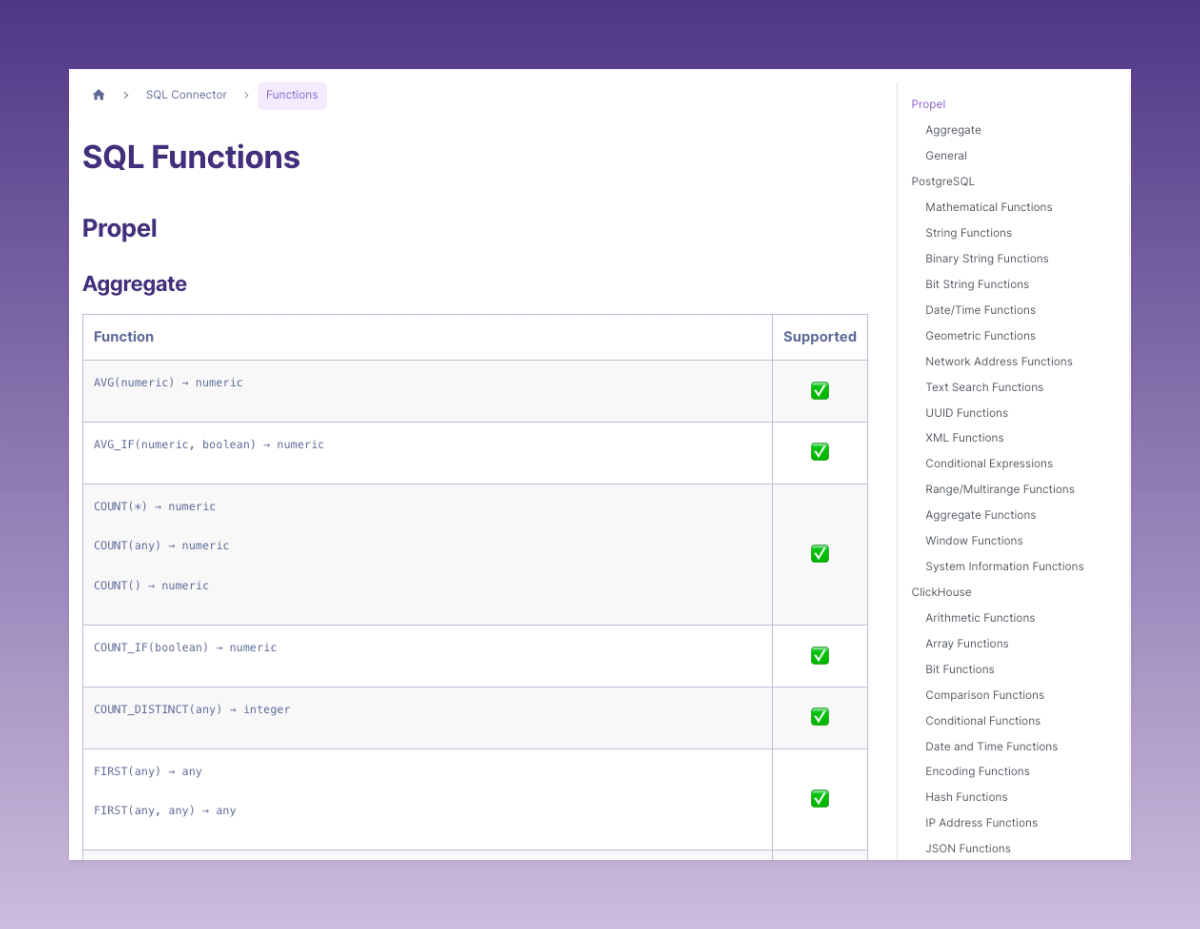
New Console Navigation
We’ve rolled out an updated Console navigation. The new menu structure and design organizes the Console into two primary sections: “Data” and “API”. The “Data” section houses all Serverless ClickHouse-related functionalities, and “API” contains all API-related functionalities.Log in to the Console to see the new navigation.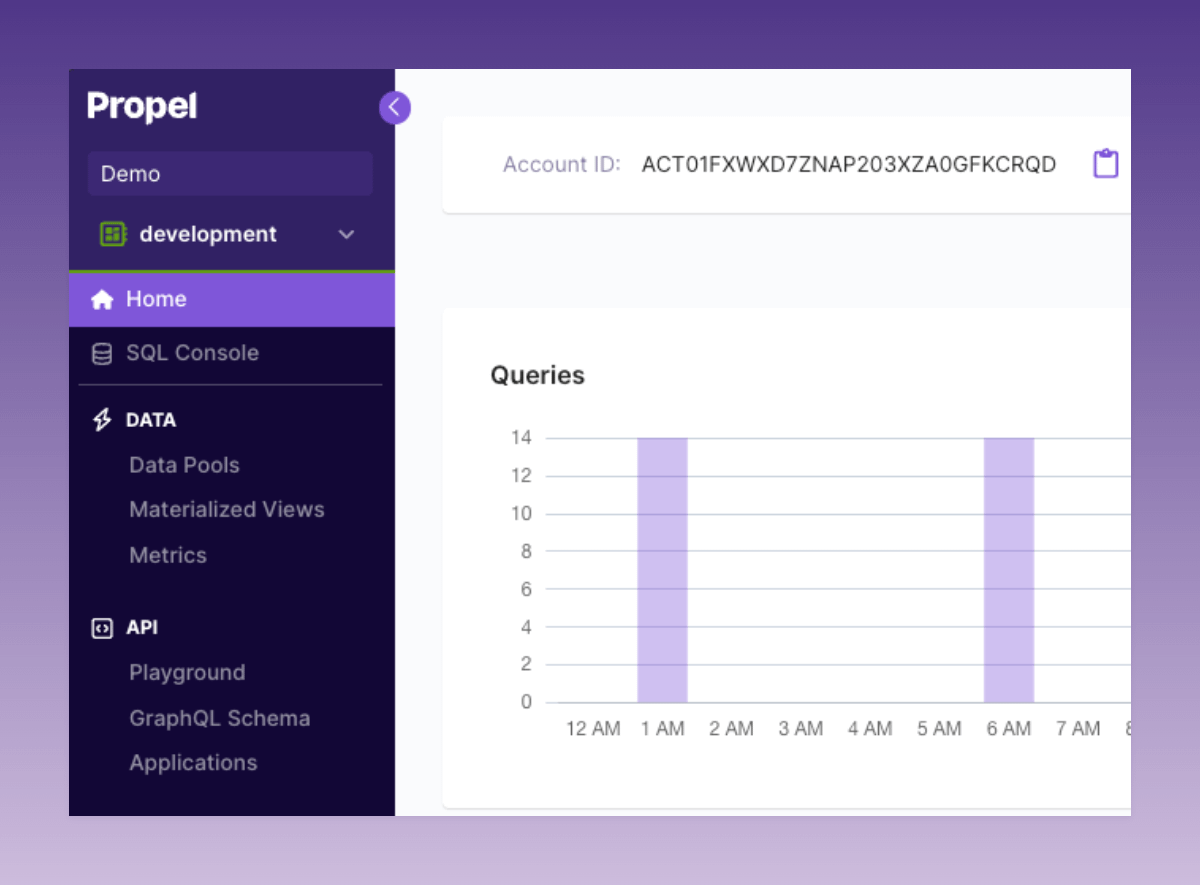
GraphQL Schema Explorer
We introduced a GraphQL Schema Explorer in the Console. Developers can now actively search through the Propel API GraphQL schema, access API endpoints with ease, and directly download the schema from a provided URL.Check out the new GraphQL Schema Explorer in the Console.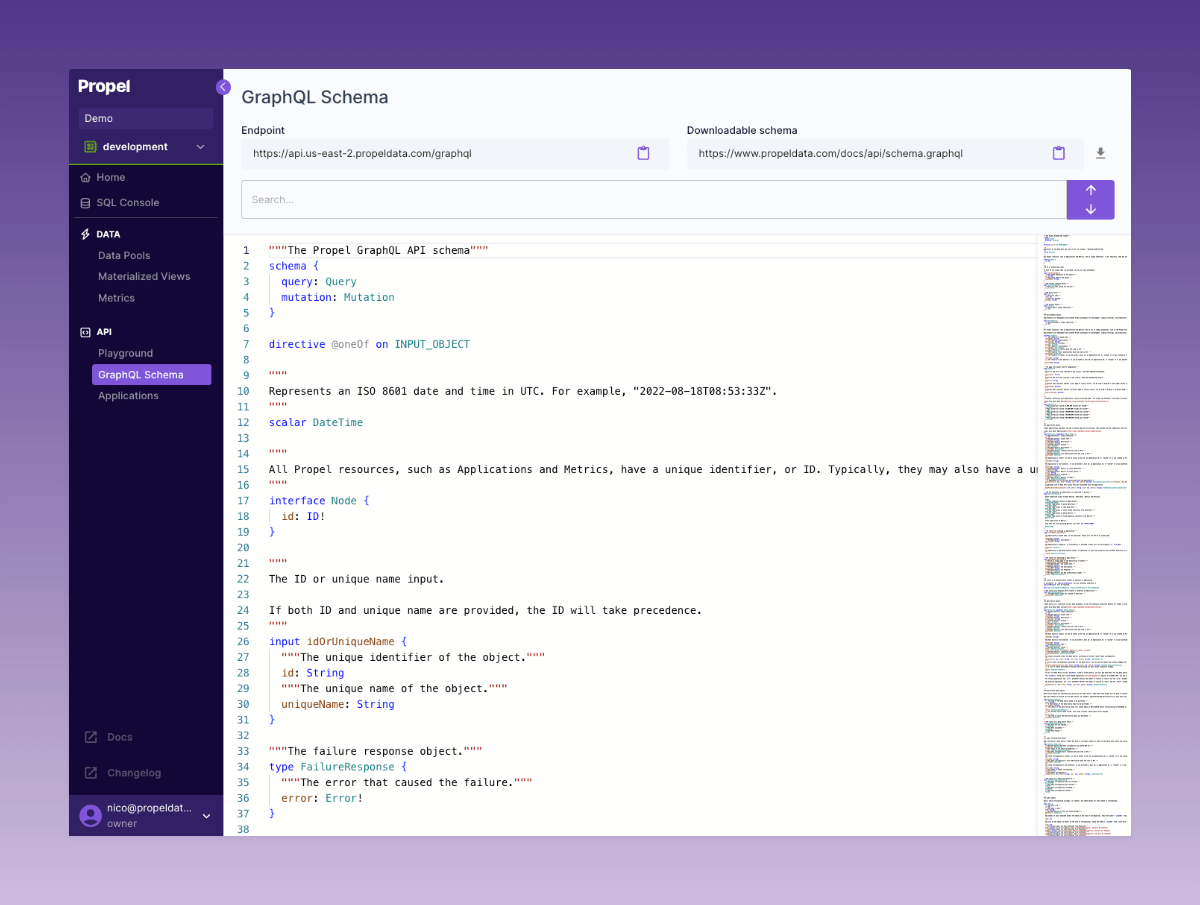
Fixes
Ingestion
- We resolved an issue with the S3 Data Pool that caused a persistent “CONNECTING” state when customers used an “s3://” or “https://” prefix in the URL for their table path, rather than a relative path within the bucket. Now, if the provided “s3://” or “https://” URL points to the named bucket, the URL’s path is used as the relative path into the bucket. Invalid table paths provided by the customer will now be synchronously rejected.
Console
- We fixed the SQL Console to respect the Propeller selection.
- We fixed the GraphQL Playground to respect the Propeller selection.
- When creating a Data Pool, we fixed the case when a timestamp is not selected.
- In the API Playground, we fixed leaderboard dimensions clearing for ClickHouse Data Pools.
- In the API Playground, we fixed the leaderboard table view width and height.
- In the API Playground, we fixed the time dimension not pre-populating.
- In the SQL Console, we fixed result cell wrapping.
- Data Pools created by Materialized Views now see the “Operations” tab.
Improvements
SQL
- The SQL interface now properly handles identifier quoting.
- We now support CASE statements in SQL.
API
- The query APIs now support SQL-style filters. Everywhere you could provide
filters, you can now providefilterSql. For example, see thefilterSqlparameter in the counter API. - Data Pool Access Policies can now be defined with the new
filterSqlparameter that supports SQL-style filters.
Console
- The API Playground will now populate filter values using the Top Values API.
- The API Playground now includes an “All time” option for the relative time range.
- The API Playground has a new layout for TimeSeries, Counter, and Leaderboard APIs.
- The API Playground now supports setting a “Time Dimension” that is different from the Data Pool’s default timestamp.
- The API Playground will now show the Data Pool selection first.
- The API Playground will now only show the “Existing Metrics” for the selected Data Pool.
- The SQL Console has a new improved layout.
- The SQL Console has new improved SQL syntax validation.
- The SQL Console will now show long result values in a tooltip when they are trimmed.
- The Data Pool list page will not break if the sync activity query fails.
- When creating and updating Amazon S3 credentials, the path and bucket will be trimmed to prevent white spaces from being accidentally entered.
April
New features
ClickHouse Data Pool beta
The ClickHouse Data Pool enables you to read through to your self-hosted ClickHouse or ClickHouse Cloud rather than syncing data to Propel. This allows you to utilize the data in your analytic dashboards, reports, and workflows directly from your ClickHouse instance through the Propel APIs and UI components.Learn more about the ClickHouse Data Pool.
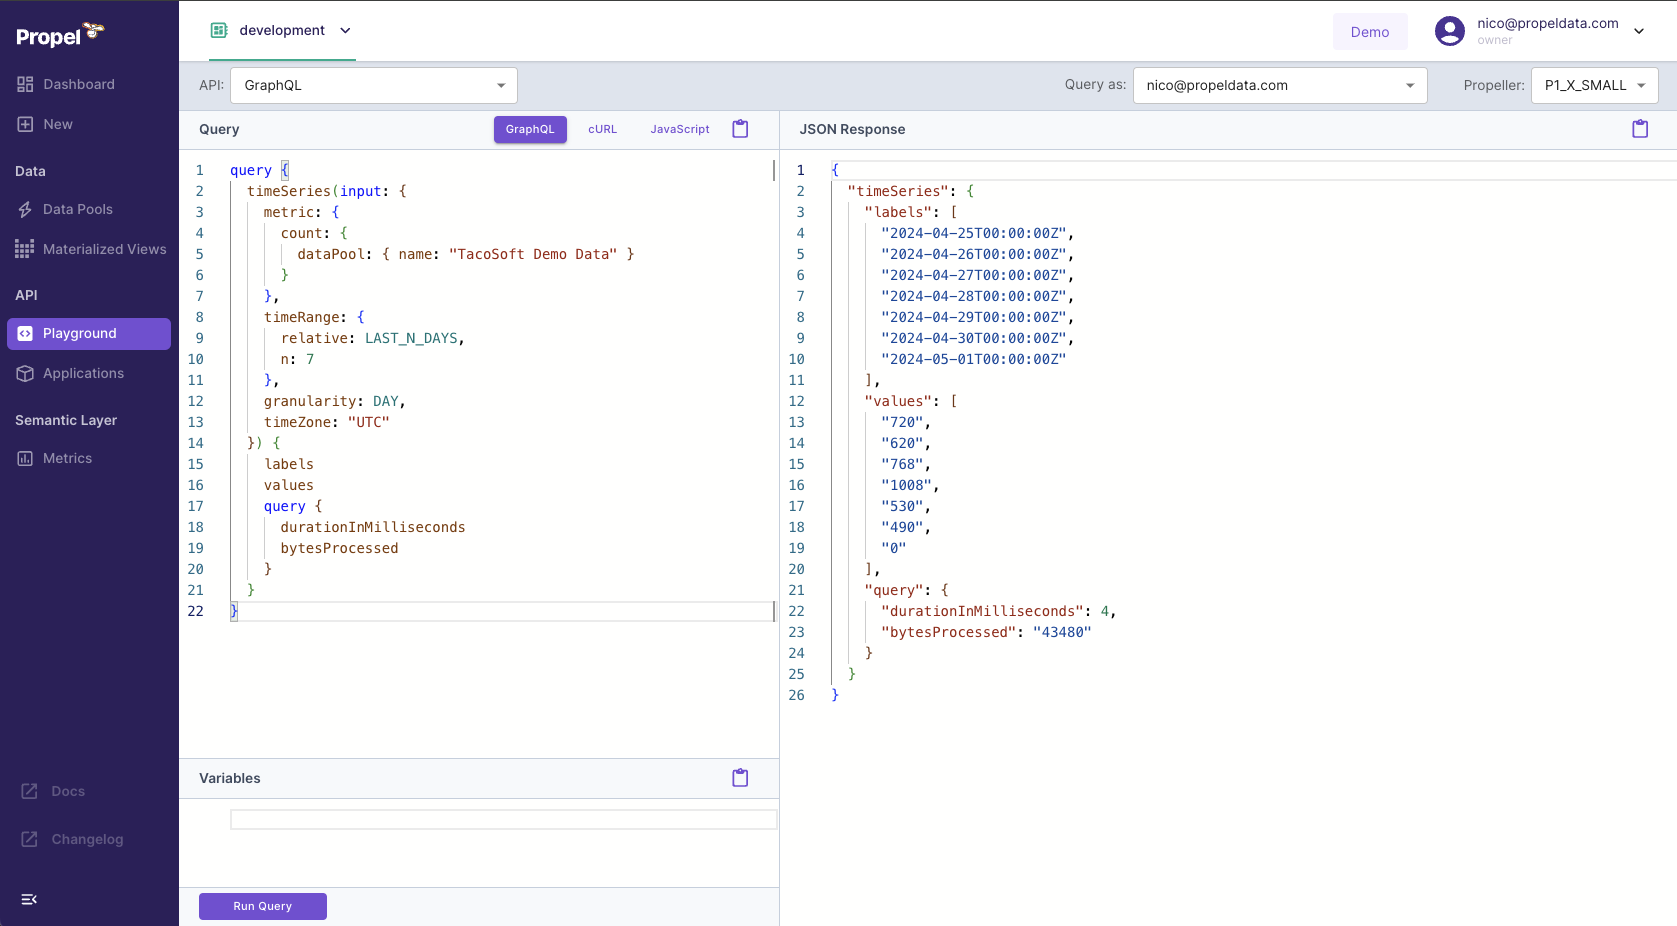
GraphQL Playground
The GraphQL Playground enables you to run GraphQL queries directly from the Console, offering a simple way to interact with your data when building applications.Key Features:- GraphQL schema autocompletion
- Code examples
- Access token generator
Fixes
- Fixed AND/OR logic bug in SQL.
- Fixed typo in default Webhook Data pool name.
- Free trial plan no longer expires incorrectly.
- Fixed case-insensitivity in Materialized Views.
- Fix automatic syncing of HTTP Data Sources which contain multiple HTTP Data Pools.
- Fixed the column
_propel_synced_atthat was incorrectly set for some Webhook Data Pools, resulting in out-of-range values. - Fixed columns length validation for Kafka on Data Pool creation.
- Fixed a race condition while re-assigning Access Policies.
Improvements
- You can now create Data Pools with ClickHouse types via the API.
- Implemented improvements to our access token API that reduced/eliminated the HTTP 500 errors that some customers experienced.
- Added support for AggregatingMergeTree table engine for Data Pools via the API.
- The Webhook Data Pool now returns HTTP 413 Content Too Large error if the payload exceeds 1,048,320 bytes or has more than 500 events.
- Add support for read-only filterSql with a SQL representation of the filters.
- Raised the GraphQL aliases limit to 250.
- Improved the case insensitivity matching for identifiers in SQL.
- Added support lists of strings and lists of numbers in Postgres SQL.
- Added support NOT IN and AT TIME ZONE operators in SQL.
- Added support column auto aliasing in SQL.
- Added support for unary expressions in SQL.
- Added support for CURRENT_DATE in SQL.
March
⚡️ 10x faster ingestion for the Webhook Data Pool
The Webhook Data Pool now ingests events 10x faster. We have optimized ingestion so that data is available within single digit seconds.Learn more about the Webhook Data Pool.
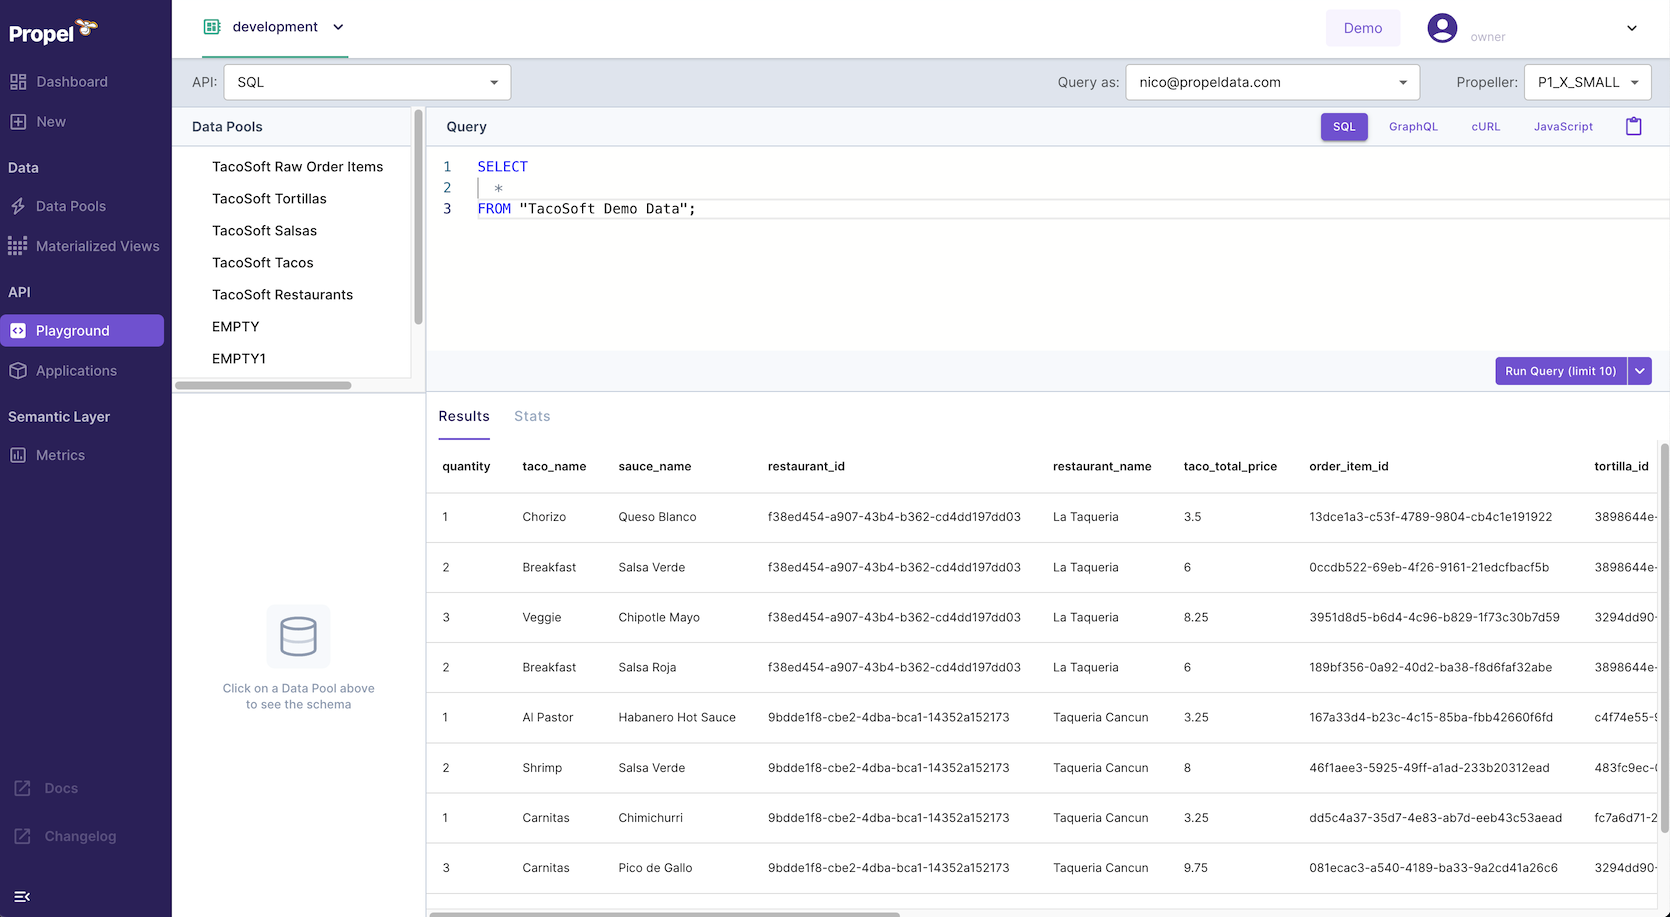
🛝 SQL Playground
With Propel’s new SQL Playground, you can now execute SQL queries directly from the Console. It provides you with an easy way to explore your data when building applications.Key Features:- Code examples: easily integrate queries into your code. Get code examples for querying data using SQL via the API, cURL, and JavaScript.
- “Query as” selector: simulate querying as your app. Different apps have unique data query permissions set through Access Policies. The Playground allows you to test queries as a specific app.
- “Propeller” selector: experiment with query speeds. Test different query speeds to optimize performance and cost for your data application.
✈️ Airbyte destination
The Airbyte destination lets you synchronize data from over 350+ sources to Propel’s Serverless ClickHouse infrastructure. It provides an easy way to power your customer-facing analytics and data applications with data from any SaaS application, database, or platform supported by Airbyte.Learn more about the Airbyte destination.
Fixes
- Customers will be able to change the URL in their ClickHouse credentials on creation flow in the Console.
- Customers will not see stale data when modifying credentials for ClickHouse and Kafka in the Console.
- Signed in customers will be redirected from /login to dashboard.
- In the GraphQL Playground, customers will be able to clear the variables input and run queries with no variables.
- Fixed a bug when parsing table names that contain aliases in SQL.
- Fixed a bug where table aliases where being lowercased in SQL.
Improvements
- By setting the
disable_partial_success=truequery parameter, you can ensure that, if any individual event in a batch of events fails validation, the entire request will fail. For example:https://webhooks.us-east-2.propeldata.com/v1/WHK00000000000000000000000000?disable_partial_success=true - Added SUBSTRING function to SQL.
- Added support for extracting parts from a timestamp in SQL.
- Raised SQL response size limit to 2 MB.
- The PostgreSQL interface now supports extended queries.
February
Kafka Data Pool
The new Kafka Data Pool lets you ingest real-time streaming data into Propel. It provides an easy way to power real-time dashboards, streaming analytics, and workflows with a low-latency data API on top of your Kafka topics. Learn more about the Kafka Data Pool.
🆓 New Generous Free Tier
We are introducing a new, generous free tier! It includes up to $15 of usage per month, and the best part is, it does not expire. Sign up and get started today.
䷰ Schema evolution: Add a column to Data Pool operation
We are introducing Schema Evolution for Data Pools with the ability to add new columns to your Data Pools. Now, you can add new columns to your Data Pools, allowing you to evolve your data schema as your needs grow and change.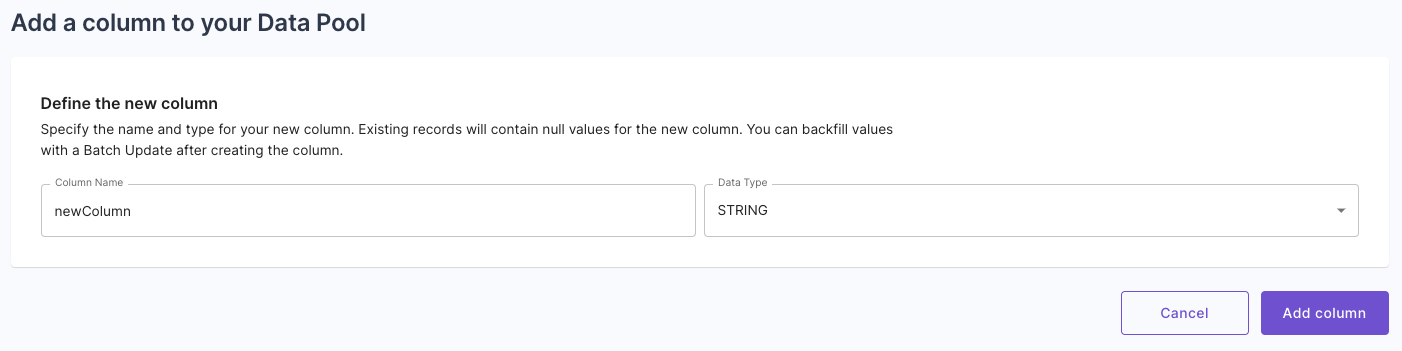 Learn more about the Add column to Data Pool operation.
🚚 Batch delete and update operation
The new batch delete operation helps you stay GDPR compliant by providing a straightforward way to permanently delete data from a Data Pool. Meanwhile, the batch update operation helps maintain data integrity and facilitates data backfilling in the event of schema changes. Both operations can be done via the Console or API.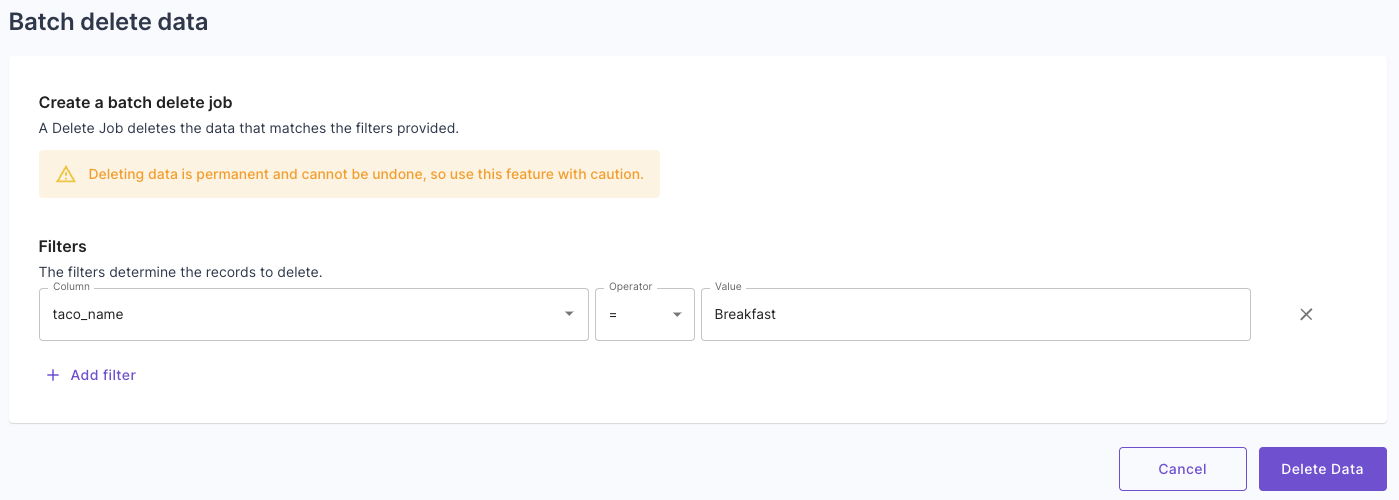 Learn more about batch updates and deletes.
🪵 React UI Kit logging controls
The Propel UI Kit now features logging capabilities for faster development and clean logging in production. By default, all errors are logged to the browser’s console. This behavior can be customized using the LogProvider component. The LogProvider uses React’s context mechanism to propagate log settings to nested components, allowing for specific component logging. Available log levels include “error”, “warn”, “info”, or “debug”.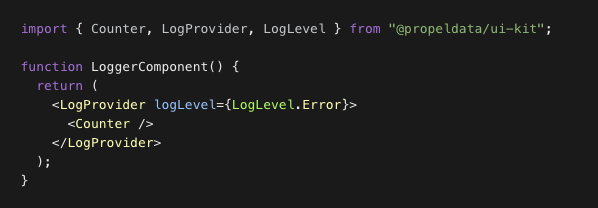 Learn more about the React UI Kit’s logging controls.
Fivetran preview
The Fivetran destination lets you synchronize data from over 400 sources to Propel’s Serverless ClickHouse infrastructure. Learn more about our Fivetran destination.
Bring your own ClickHouse preview
The ClickHouse Data Pool reads through to your self-hosted ClickHouse or ClickHouse Cloud rather than syncing data to Propel.Learn more about the ClickHouse “read-through” Data Pool.Fixes
- Fix timezone argument on
toStartOfWeek,toStartOfMonth, andtoStartOfYearSQL functions. - Fixed login loop for accounts with Okta integration.
- Fixed environments dropdown in Console in the new Data Pool page.
- Fixed the Preview Data section of the Console where customers can now change time range and page size when the query results in a time out or an error.
Improvements
- Add support for timestamps without timezones
- Support
NOW()andCURRENT_DATEfunctions in SQL. - Support
INTERVALin SQL. - An alternative
timestampcan be supplied toTimeRangeInputwhen querying. - Customers can view TableSettings (
engine,partitionBy,primaryKey, andorderBy) for their Data Pools via the API. - Allow creating Data Pools (including Webhook Data Pools) without
timestampvia the API. - Allow setting TableSettings (
engine,partitionBy,primaryKey, andorderBy) when creating a Data Pool via the API. - In the Console, customers can have a different environment in multiple tabs without losing the last selected state.
- In the Console, Customers will see the
processedRecordsinstead ofnewRecordsin the Processed Records column for the Syncs table. - Customers can now change the sort and timestamp column in the Console in the Preview Data tab.
January
🔎 SQL API
You can now query any Data Pool using SQL over the GraphQL API. Need to join, group by, or perform complex queries? No problem. Propel’s SQL supports PostgreSQL syntax, including joins, unions, and common table expressions for more complex queries. The SQL API allows you to query your data however you’d like, and Propel’s multi-tenant access policies ensure that customers can only query their own data.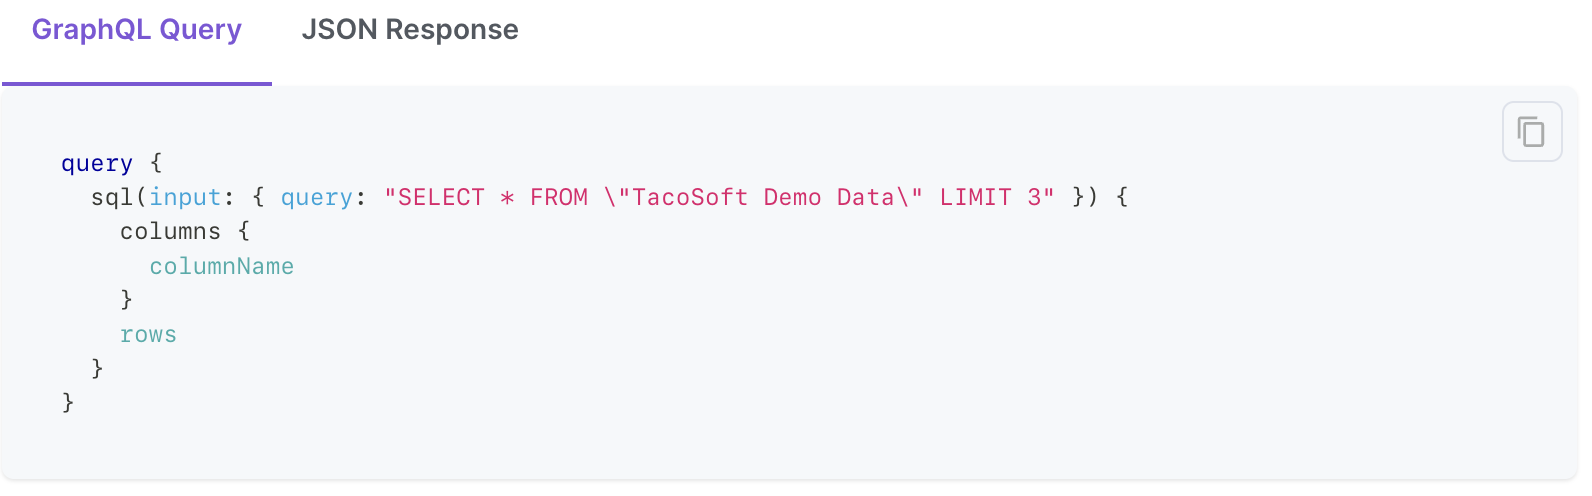 Learn more about the SQL API.
🐘 PostgreSQL-compatible SQL interface
You can now connect any BI tool or PostgreSQL client to Propel. Essentially, Propel mimics a PostgreSQL instance, providing a seamless connection to a variety of tools or client applications.For SaaS applications, this simplifies the process of providing a customer-facing SQL interface for custom reporting and data sharing.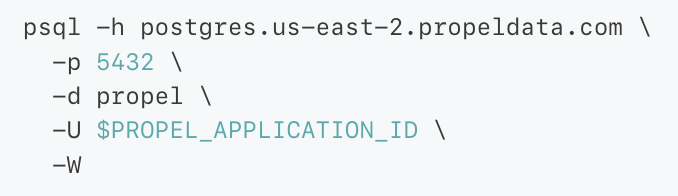 Learn more about the SQL interface.
🗄️ Data Grid API
The new Data Grid API efficiently retrieves individual records from a Data Pool, with the added convenience of built-in pagination, filtering, and sorting. It’s perfect for displaying data in a table format, making it ideal for data tables with individual events, orders, requests, or log messages.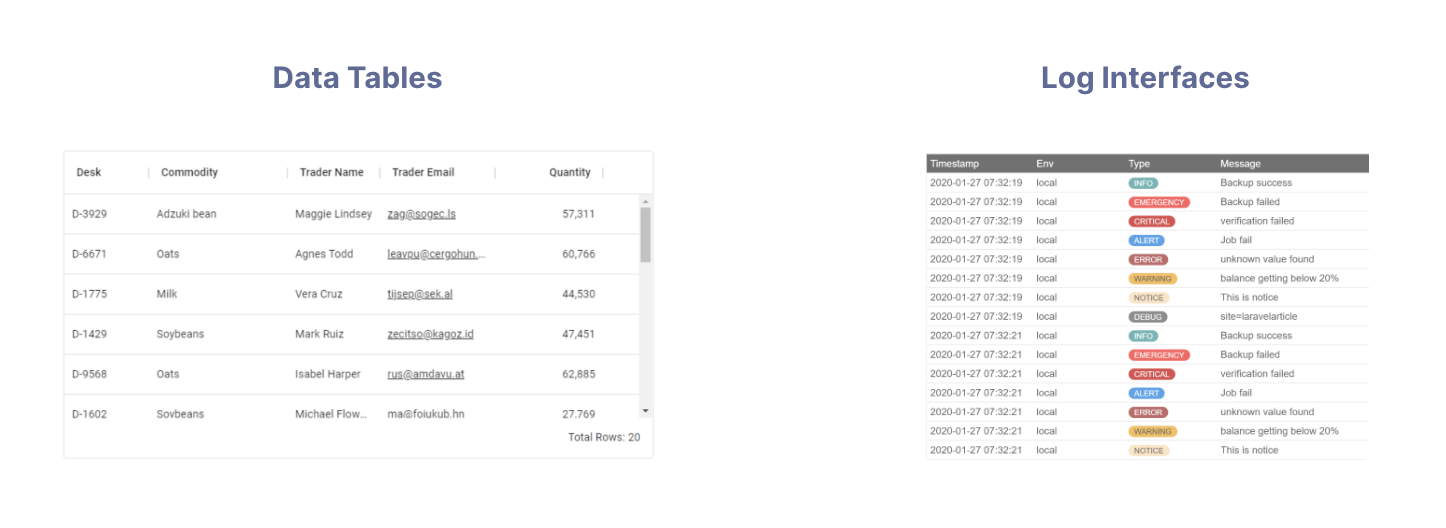 Learn more about the Data Grid API
📌 Records by ID API
The new Records by ID API is optimized for quick, unique ID lookups. It returns the records corresponding to the given IDs. This API can present detailed record information in a data table or record detail page.Learn more about the Records by ID API.🧮 Top Values API
The new Top Values API returns the most common values in a specified column ordered by frequency. The Top Values API can populate UI filters, prompt available values to AI agents, or showcase trending values within a column.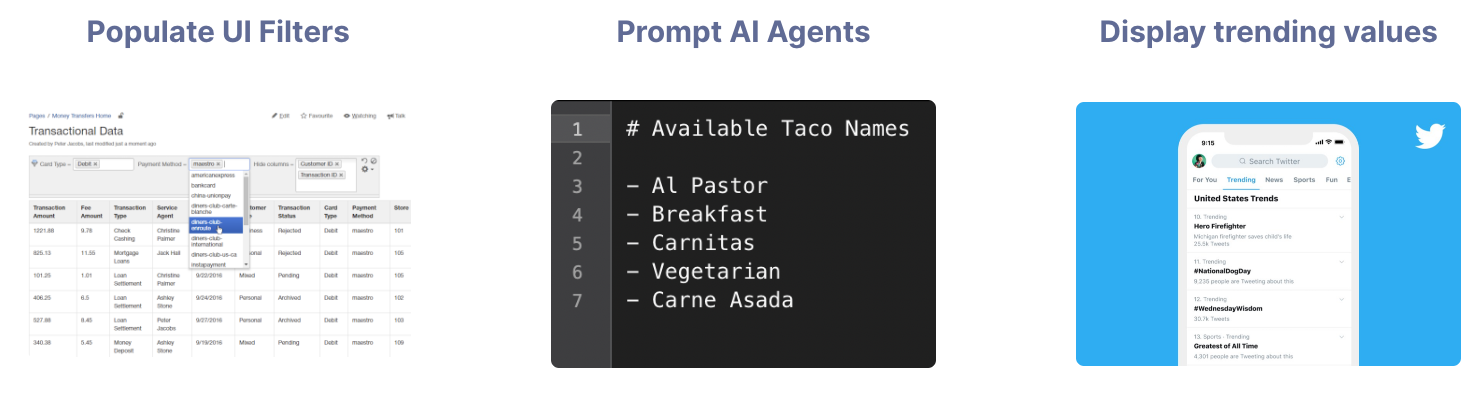
💚💙💜 UI Kit themes
You can now control the look and feel of all your UI components in one theme. The theme of the UI Kit determines all essential visual elements, including the colors of components, the depth of shadows, and the overall light or dark appearance of the interface. We provide light and dark themes out of the box and the ability to customize your own theme.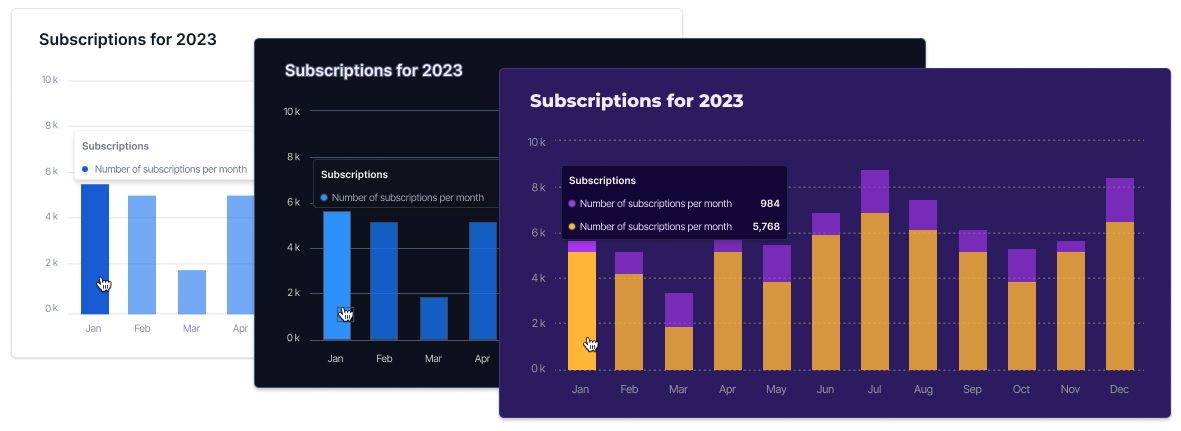 Learn more about themes in the UI Kit.
🔓 UI Kit Access Token Provider
You can now easily fetch and refresh API access tokens from the frontend. The newAccessTokenProvider component allows you to provide a function that fetches an access token from your backend. Using this function, the provider will serve the fetched access token to all its child components and automatically refresh the token when it expires.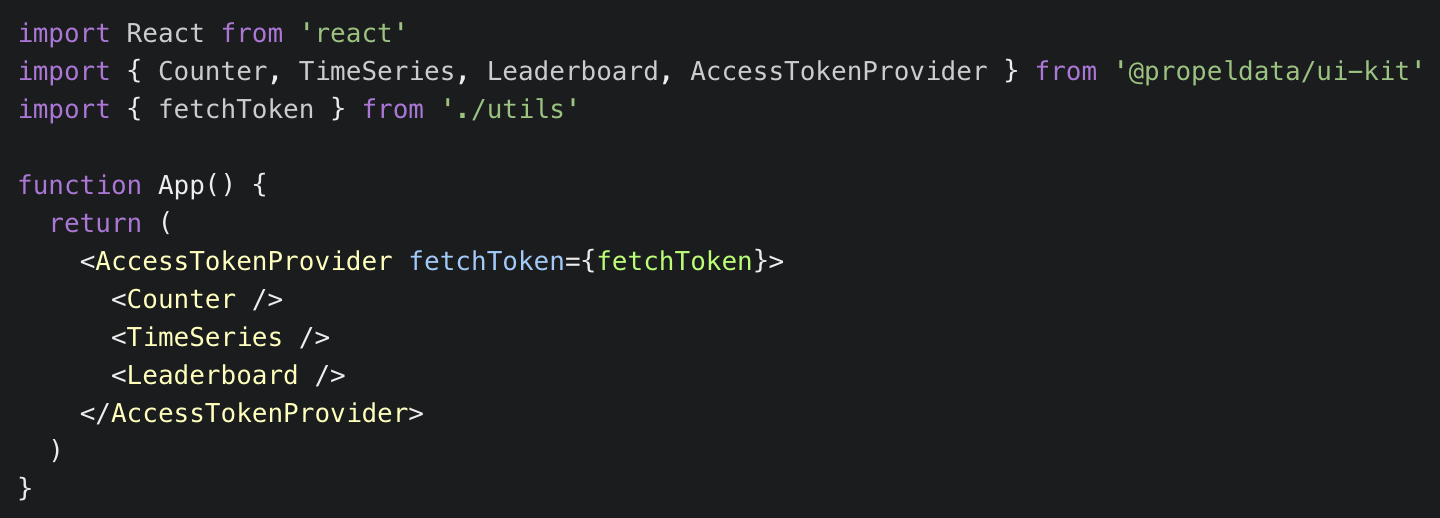 Learn more about the Access Token Provider.
⏳ UI Kit Filter component
The new Filter component simplifies the process of adding filters to your dashboards. It uses Propel’s Top Values API to fill the dropdown list with unique values from a specific column, arranged by their frequency.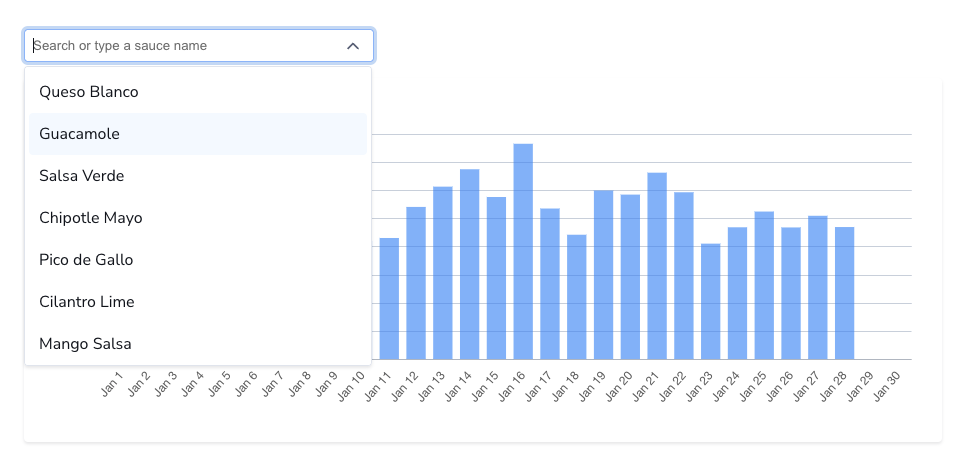 Learn more about the filter component.
🍰 UI Kit Pie Chart component
The PieChart component is designed to create pie or doughnut charts using the Leaderboard API.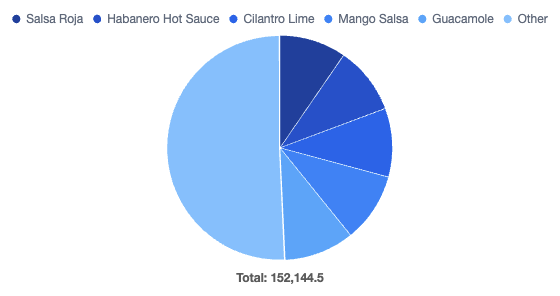 Learn more about the Pie Chart component.
🪝 UI Kit Query Hooks
Propel’s UI Kit provides prebuilt React components for querying data from Propel’s GraphQL API. These components can be used to query data for custom visualizations or to build with third-party libraries such as D3.js, Recharts, Nivo, or Chart.js.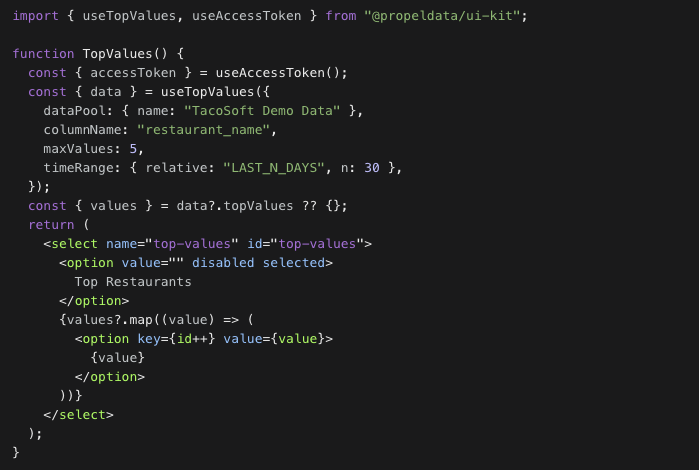 Learn more about the Query Hooks.
Fixes
- Fix timezone argument on
toStartOfWeek,toStartOfMonth, andtoStartOfYearSQL functions. - Fixed login loop for accounts with Okta integration.
Improvements
- Support LIKE and NOT LIKE filter operators in SQL and the GraphQL API.
- Support TO_TIMESTAMP function in SQL.
- Support CAST function in SQL.
- Mark the tenant ID field in the Data Pool as deprecated. No longer needed with the new Access Policies.
- Support WITH statements in the SQL API.
- Support UNION statements in the SQL API.
- New
data_pool:readscope to list Data Pools and their schemas. - We made
timeRangeoptional in GraphQL API. - The dimensions stats API has now been deprecated and replaced with the Top Values API.