December
🔓 New, more powerful Access Policies
Access Policies now allow you to control column- and row-level access to a Data Pool’s data. They provide a powerful way to govern how your applications, whether internal or customer-facing, access the data. You assign Access Policies to Propel Applications, giving each set of API credentials specific access to the data.Learn more about the new Access Policies.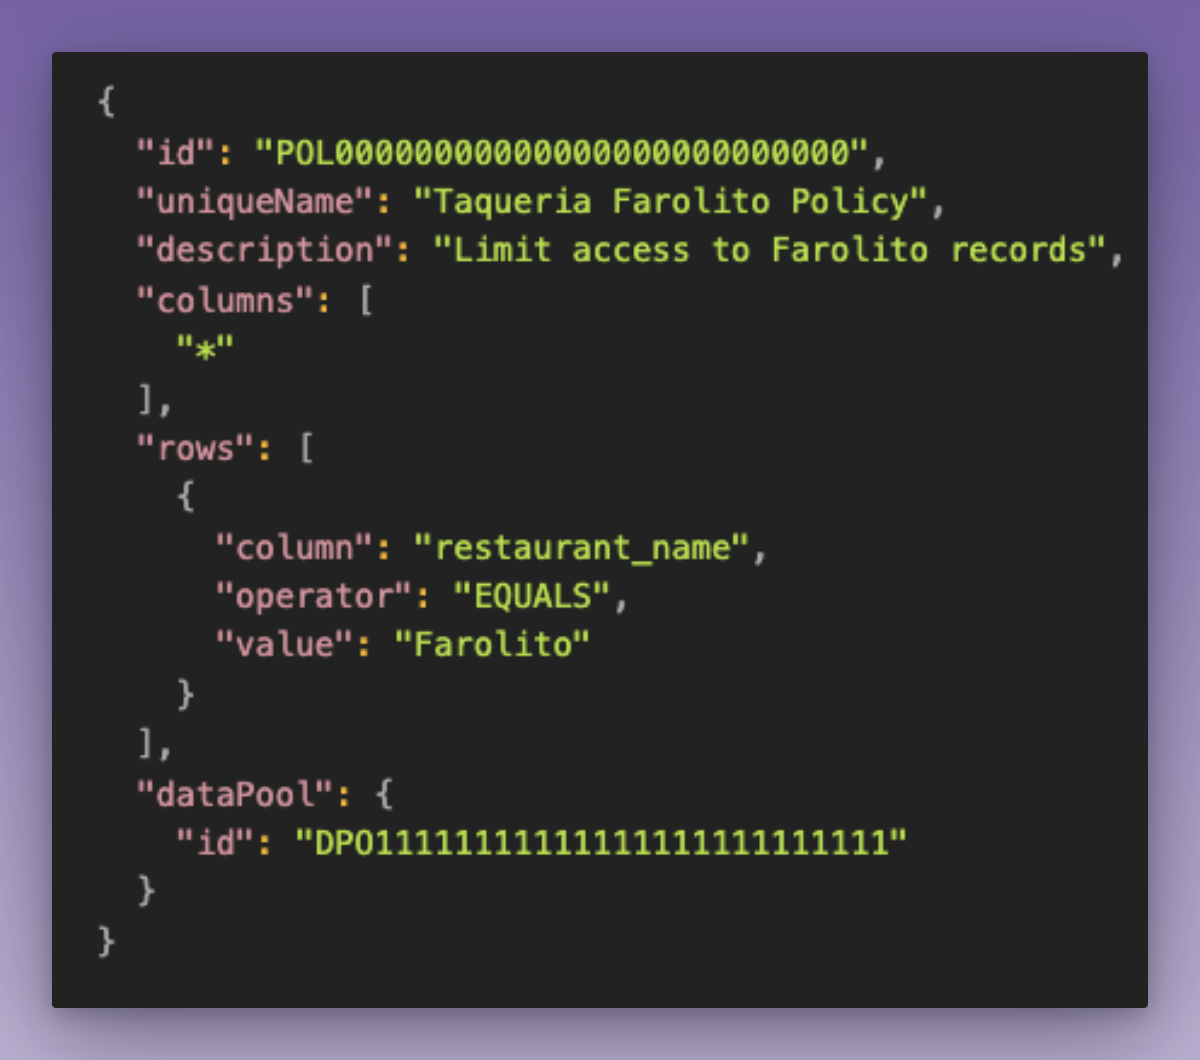
November
🔏 Dynamic Access Policies for multi-tenant applications
Multi-tenant SaaS or consumer applications have more specific data access control requirements. Each tenant should only access their own data, and the application must support potentially millions of unique tenants. Dynamic Access Policies allow you to pass policy values via a custom claim in the API access token. The policy values are cryptographically signed to the access token and used to evaluate the policy. This securely controls access to tenant data without the need to create a policy for each tenant, which could be cumbersome.Learn more about the multi-tenant access controls.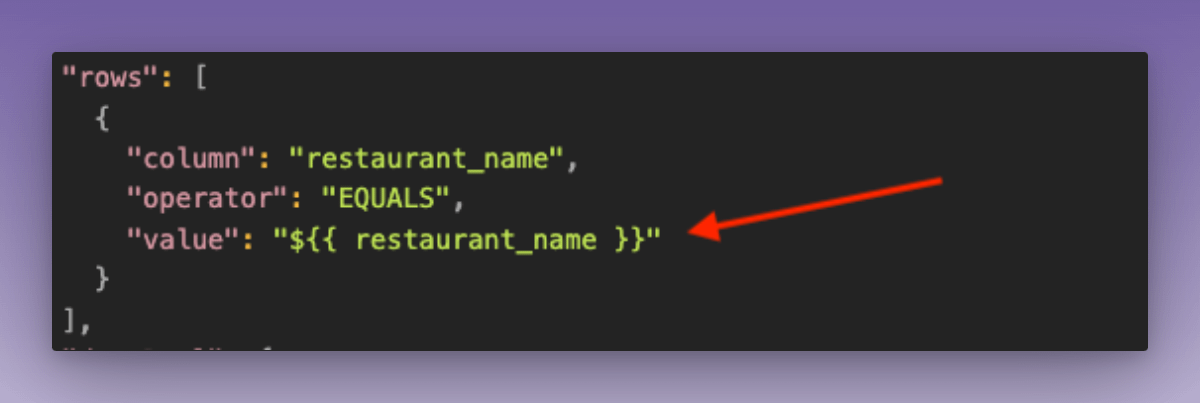
Real-time updates for Webhook Data Pools
The Webhook Data Pool supports real-time updates. It unlocks advanced analytics use cases where you have to deal with late-arriving data that needs to be updated in the original record. Real-time updates have the additional benefit that you can safely retry requests without worrying about creating duplicates.Read the real-time update docs to learn more.🚦 New conditional aggregate functions for Custom Metrics: COUNT_IF, SUM_IF, and AVG_IF
These new functions enable you to define Metrics by aggregating records based on certain conditions.Let’s say you want to calculate the Net Promoter Score (NPS), a common metric for customer satisfaction. NPS is calculated based on responses to a single question: “On a scale of 0-10, how likely are you to recommend our company/product/service to a friend or colleague?” Responses are classified as follows:- Promoters (score 9-10)
- Passives (score 7-8)
- Detractors (score 0-6)
COUNT_IF to calculate NPS:Fixes
- We fixed a bug in the custom expression validation. We were allowing unknown columns to be present in comparison expressions.
- We fixed a bug in the Playground in the Console where customers could not select a metric type in Playground when they didn’t have Metrics created.
- We fixed a bug in the Console where the query count by Application and by Metric was not shown correctly.
Improvements
- New Applications will have the DATA_POOL_QUERY and DATA_POOL_STATS scopes by default.
- In the Console, customers can now see the basic authentication information for the Webhook Data Pool URLs if authentication is enabled.
- In the Console, customers can view failed events for Webhook Data Pools in the new Error log.
- In the Console, customers can create custom queries in the Playground by Metric type and Data Pool.
- New customers will see the first-time user experience cards until the first Data Pool is created.
- We improved the error messages that are shown when querying Data Pools and Metrics without the expected scope.
- We now return a Bad Request Error if clients provide invalid time zones.
- We added comparisons to Custom Metrics, and now expressions like SUM(foo > 1) or SUM(foo IS NOT NULL) are supported.
- We added IS and IS NOT comparison operators to the custom expressions.
October
New features
- 🎉 Self-serve sign-up is open! You can now sign up to Propel and get started without filling in a form or contacting us.
- 🕸️ New Webhook Data Pool. This new Data Pool type allows for easy ingestion of JSON events into Propel. Webhook setup and management is available in both the console and via our GraphQL API. The console has a rich UX for easily building and testing your JSON schema to match the event structure. Check out the documentation.
- 🌮 We have a new and improved Quickstart to get you going with sample data as fast as possible.
- 💥 New Console navigation. We’ve streamlined the navigation and introduced the concept of Credentials for Data Pools. (For existing customers: Credentials replace the concept of Data Sources within the Console. No changes have been made to the public APIs.)
- 🛝 New top-level API Playground! The API Playground used to be available inside each metric definition in the Console. We’ve moved it out into the main navigation, making it easier than ever to query your metrics.
- New code samples in the API Playground. In addition to grabbing sample GraphQL code for your queries, you can now copy full cURL and JavaScript samples for making queries - right from inside the playground.
- 👩🏽💻 UI Kit Code Examples. The UI Kit’s documentation in Storybook now has code examples for each component.
- 📊 Added support for custom label formatting in the Leaderboard component in UI Kit. See the pull request.
Fixes
- We fixed an issue when using MAX, MIN, FIRST, LAST, and ANY aggregate functions inside an arithmetic expression and their first argument is a JSON column. Expressions like
MAX(foo.bar)/60now work correctly. - We fixed a bug in the LAST aggregation function when the LAST function call was not a top-level operation in the expression.
- We fixed issues with DATE formatting in some instances in Parquet files used in ingestion.
- We fixed a navigation issue in the Console for users with smaller screens.
- We fixed an issue with the navigation collapse arrow for the menu.
- We fixed an issue with displaying a selectable timezone in the playground.
- We fixed an issue with displaying Custom Metrics filters in the “Settings” tab of a Metric.
Improvements
- Our documentation now features a new navigation system that categorizes data sources into events, data warehouses, and Gen AI sources.
- In the Console, we’ve introduced a time range selector to the “Preview Data” tab for Data Pools.
- On supported Data Pools, customers can now trigger manual syncs even when syncing is paused.
September
New features
- ➗ ✖️ ➕ ➖ New Custom Metrics type. Custom Metrics enable you to define custom expressions to aggregate data from your Data Pool. This provides a more flexible approach to defining Metrics that capture more complex business logic.
- 🥇 LAST and FIRST aggregation functions for Custom Metric expressions. Read the docs.
- % PERCENTILE aggregation functions for Custom Metric expressions. Read the docs.
- ❄️ Propel can now synchronize data from Snowflake views as well as standard tables and dynamic tables. Read the blog post.
- 💰 We launched self-service billing, usage reports, and our trial plans. Log in to the Console and go to the new Billing section.
- 📒 The React UI Components have new documentation in Storybook.
Fixes
- We fixed a bug where Metrics could created for a given Data Pool outside the context of an environment.
- Fixed an issue on signup with special character handling.
- Fixed an issue where queries were executing during Console sign-out.
- Fixed an issue in the UI kit with time series label granularity displaying incorrectly.
Improvements
- We’ve made several improvements to the underlying performance of Data Pools that connect to Snowflake and have updated records.
- Customers will be able to select a timezone for queries in the Playground.
- We improved the text descriptions of Data Pool creation fields in the Console.
- Customers will now see top-level GraphQL queries for the playground instead of the metric query.
- Various stability and performance enhancements to file handling with Amazon S3.
- We added a search functionality on our documentation site.
- We’ve added new guides to our docs:
August
New features
- ❄️ Propel can now sync updates and deletes from your Snowflake data, unlocking a host of new use cases! Learn more.
- 🍽️ Propel can now synchronize data from Snowflake Dynamic Tables. Learn more.
- ⏰ Queries now support setting time zones. Learn more.
- 💰 We updated pricing for the P1_X_SMALL propeller. See pricing.
Fixes
- Time Series queries were sometimes returning unexpected numbers of granules (e.g., when passing
timeZone). For example, asking forTODAYwith granularityDAYshould always return a single granule; asking forTHIS_WEEKwith granularityDAYshould always return seven granules. This is now fixed. - Multiple S3-based files with the same name in different directories are now handled correctly.
- Fixed a bug with wrong validations in the Leaderboard query builder in the Console, not allowing the query to execute.
- Fix Metric overview documentation links in the Console.
- Fixed error state for sparklines in the Console.
- Fixed a bug with tooltips showing for sparklines in the Console.
- Fixed an issue with time series charts in the console not starting at 0.
- Fixed an issue with Propeller time-out errors showing twice in the Console.
- Fixed a bug where an erroneous 0 would show up in filter lists in the Console.
Improvements
- Syncs have a new
processedRecordsproperty. It is the sum of the existing propertiesnewRecords,updatedRecords, andfailedRecords. This is in support of the updating Data Pool functionality. - Better and more detailed errors for different Data Pool errors on creation and sync in the console and API.
- Graphs in the Console now render using the browser timezone.
- Customers can now more easily paste or type into all autocomplete components in the Console.
- Setting a filter value in the Metric Playground will now provide autocomplete for less than 1000 values, and free text type in all cases.
- New, better design for Applications listing page in Console with ID, scopes, and Propeller displayed.
- The UI Kit now uses Luxon under the hood for better date handling.
- On the docs, the Quickstart now introduces how to set up a Propel Application and use it in the Next.js starter app.
- On the Leaderboards, Counter, Time Series, and Metric Report overview docs, we now use TacoSoft (our Quickstart data set) in all example queries.
- On the Leaderboards, Counter, Time Series, and Metric Report docs, we updated query examples to use the up-to-date top-level query structure (
metricNamein query input instead of the deprecated metricByName or metricById). - We made visual improvements in the navbar on the docs site with higher contrast.
July
New features
- 🌮 Customers are now able to create sample data with the new TacoSoft Data Source.
- 🟣 New Console look and feel.
- 💦 The UI Kit supports a new prop,
refetchInterval, which can be used to specify how frequently a component should re-fetch new data. - 📦 We have simplified UI Kit and re-packaged it as a single, tree-shakeable NPM library, @propeldata/ui-kit.
Fixes
- In the Metric Playground, we fixed an issue with the filter drop-downs not showing values. Customers can now select a unique value from the drop-down when using filters in the Playground.
- Fixed an issue with unique name-checking. Customers will now see validation for every unique name in the console.
- Fixed a bug in the Metric Report API where users could select dimensions not declared in any of the report’s Metrics. Now developers are only able to select dimensions specified in the Metrics.
- Fixed a Counter Metric performance regression.
- Fixed a corner case where new Data Pools were getting stuck in the “CREATED” state.
- Fixed a bug where if a measure or dimension column in a Metric is JSON, we were not taking it into account as part of the available columns to be selected.
- Fixed an issue with the calculation of query timeouts. Some queries were incorrectly timing out at 3 seconds when they should time out at 10 seconds.
- Fixed a password reset bug.
- Fixed an issue where we were missing time granules for certain relative time ranges.
- The Amazon S3 Data Source now supports syncing larger S3 buckets, and will sync up to 1,000 files at a time.
- Previously, S3 Data Sources could be created with invalid S3 bucket names, resulting in them getting stuck in a “CONNECTING” state. Now, when attempting to create or modify an S3 Data Source, setting
bucketto an invalid S3 bucket name will result in synchronous failure with aBAD_REQUESTerror message: “Invalid S3 bucket name; ensure you pass only the S3 bucket name and not its ARN or URL”. - Customers can now switch tables and see the updated schema when creating a Data Pool. Previously, the schema was not updated when switching tables.
Improvements
- New homepage with a handy video!
- In the Data Pool section of the Console, we have improved the Sync error messages for Snowflake and S3 Data Sources. Customers will now see a helpful message with the error details for failed Syncs in the Data Pool overview syncs table.
- In the Metric definition, Metric settings, and Playground sections of the Console, the filter operators IS_NULL and IS_NOT_NULL are now available.
- In the Data Pool section of the Console, the “Preview Data” table now loads faster and adjusts to the screen height. Additionally, the text in the cells of the table will not wrap, and an ellipsis will be displayed when the text is too long.
- In the Data Pool section in Console, we updated Data Pool documentation links.
- We have improved API error messages for our customers. Authentication and authorization-related errors and identifier parsing errors will no longer be returned as internal errors. Instead, we catch these errors and provide more informative error messages.
- We have improved the handling of query errors by introducing a new error that specifically indicates when the Propeller is too small. If a Metric query exceeds the maximum execution time, customers will now receive a more informative error message. The message will indicate that the user needs a bigger Propeller instead of a generic error message such as “The query failed for an unknown reason.”
- Data Pool Syncs are now created before attempting to connect to the underlying database, resulting in earlier visibility. Previously, if we failed to connect to a database, we did not create any Sync and kept retrying until successful. With the new process, we create failed Syncs that represent unsuccessful attempts, improving visibility for customers.
- The Console now remembers the last environment a user accessed when switching between accounts.
- The Console now remembers the last account and environment a user accessed when logging back in.
- If a user has never logged in, the Console defaults to their most recently created account and its development environment.
June
New features
- 😍 Support for Querying JSON data and JSON data type. Snowflake users can now sync their VARIANT, OBJECT, and ARRAY columns as JSON to Propel. Read the blog post
- 🛠️ New data synchronization controls are now available for Snowflake. Read the blog post.
- 🌮 You can now provision demo data for TacoSoft, our imaginary B2B SaaS taco-selling application. The demo data will make it easier to experience the full power of Propel.
- 🤓 We introduced a new METRIC_READ scope, which enables developers to list metrics without requiring full ADMIN scope. This new scope allows Propel Applications to retrieve and list Metric resources within the Environment, without being able to query their data.
- ⛔️ We added new IS_NULL and IS_NOT_NULL filter operators for Metric and query filters. The value field in FilterInput is now nullable. If the specified filter operator is IS_NULL or IS_NOT_NULL, then the value field is not required. Otherwise, the value field is required, and the request will be rejected if it is not present.
Fixes
- Fix to allow modifying AND and OR Filters on Metrics.
- Previously, a bug was triggered when customers provided an invalid Snowflake account, causing their Snowflake Data Source to become stuck in the “CONNECTING” state. This issue has now been fixed.
- When creating a Data Pool, customers will be redirected to the correct link for tenant ID documentation.
- When creating an Amazon S3-powered Data Pool, we now display the first empty sync instead of the “hang tight” graphic.
Improvements
- The documentation site has new styles ✨.
- In the Console, the input to create a new Amazon S3 Data Source table is now ”Unique Name”, instead of “Name”. It will show an error when the name is not unique within the Data Source context.
- In the Console, during Data Pool creation, customers will not see cached data after leaving the creation flow and returning, but it will be kept within the Data Pool creation session.
- The Terraform provider now supports creating MIN, MAX and AVERAGE Metrics. It supports setting the cursor and sync interval for Data Pools, creating and updating Policies, and it is smarter about when to replace versus update a changed resource.
May
Improvements
- Metric Report: We increased the number of supported dimensions from 2 to 10.
- Metric Report: We enabled report-level filtering. Filters can now be passed which can remove rows from the report.
- Logins and signups now use the Secure Remote Password (SRP) protocol.
- Data Pools now have a new Preview Data tab. This tab shows the most recent records synchronized to the data pools.
- Add support for Parquet data types: Map, List and Struct that are mapped to Propel column data type: JSON.
- Add support for group structures within Parquet files.
Fixes
- Fixed an issue with ingesting timestamps with a value of 0 and enhanced error handling for negative epoch timestamps.
- Fixed an issue with
WEEKgranularity starting on a Sunday. TheWEEKgranularity now starts on Monday, consistent withLAST_N_WEEKSand the week-based relative time ranges. - Fixed a bug with changing between Relative and Absolute time in the metric playground.
- Fixed a bug with the GraphQL variables when changing between relative types in the metric playground.
- Fixed a bug where the username string in the top right of the web console would show the id instead of the username.
- Fixed an issue displaying the setup checklist for S3 data source.
- Fixed a non-clickable save button on account settings.
April
- We refreshed the Overview section of our docs with new content. SAML section of our docs launched, with details of setting up Okta SSO.
- Various improvements to our React Components library, Propel UI Kit on Github.
- Added support for DeletionJobs.
- We fixed an issue with accessing customer Amazon S3 buckets in non US-East-2 regions.
- Added beta support for JSON column types.
- Added support for more kind of JSON values including support for arrays, booleans, numbers, nulls and nested objects.
March
- Launched our new website!
- Launched Metric Report
- Queries now support OR filtering
- Launced a preview of our React Components library, Propel UI Kit on Github.
- Performance optimizations for asynchronous sync operations.
- Unique names can now be up to 192 bytes.
- Allow customers to create Applications with the APPLICATION_ADMIN scope.
- Allow APPLICATION_ADMIN-scoped Applications to create other Applications with lesser scopes (e.g., ADMIN, METRIC_QUERY, etc.)
- Support DOUBLE and FLOAT column types for Tenant.
February
- Launched Terraform provider.
- Launched Grafana plugin.
- Fixed an issue with Snowflake number type support with scale greater than 9
- Adds support for “data_pool:query” and “data_pool:stats” scopes in the OAuth 2.0 API for requesting an Application access token.
- Opened up signups for Snowflake customers.
- Fixed a bug in tenant filtering for metricReport API.
- Fixed a bug that added one extra time unit at the end of time series queries with relative time ranges filters.
- Fixed a bug allowing support DOUBLE and FLOAT column types for Tenant.
- Pagination fixes in web console.
- Fix to disallow changing HTTP Data source table name after creation.
- Fixed a bug in playground visualization card height.
January
- The Console now displays a descriptive message when trying to delete a Data Pool that has Metrics attached
- The Console now displays a descriptive message when trying to delete a Metric that has an access policy attached.
- Password reset flow now works.
- The Console now returns to the last environment the user was in vs. defaulting to the prod environment.
- You can now re-order dimensions on Boosters to sort the most commonly used dimensions first.
- Added
suggestedDataPoolColumnTypeandsupportedDataPoolColumnTypesto the Column object in the GraphQL schema. - Average, Minimum, and Maximum Metrics will now return
nullfor “no data”, rather than zero. This is the mathematically correct answer. This applies to counters, time series, leaderboards, reports, and dimension stats. - Signup emails sent from Propel in response to signups, etc., will now arrive from a ”mail.propeldata.com” MAIL FROM address.
- Fixed an issue with pending DataPools that caused mismatches between DataSource columns and DataPool columns.
- We are no longer exposing stack traces in GraphQL error responses.
- Fix to correctly handle TIMESTAMP_TZ and TIMESTAMP_LTZ columns when syncing Snowflake Data Pools. This issue led to no Syncs being created for these Data Pools.