How to build Snowflake data apps with GraphQL

In this feature demo, you’ll see exactly what it takes to create and query a Metric on top of your Snowflake data warehouse using Propel’s blazing fast GraphQL API. In just five easy steps, you’ll connect to Snowflake, design a Metric, and query it with our GraphQL API.

Propel Data offers a blazing fast GraphQL API for building data apps from data that organizations already have in Snowflake data warehouse, as illustrated by this photograph of a laptop showing a real-time product dashboard with analytical reports and data visualization.

Cover photo by Carlos Muza on Unsplash

We just launched our latest feature: Snowflake as a Data Source. Now, let’s demo how to connect Snowflake and Propel via a GraphQL API that’s perfect for building in-product analytics in minutes, instead of months.

In this short tutorial, we’ll be helping you build a Snowflake data app with GraphQL. Data apps are customer-facing web or mobile apps that include native, large-scale, aggregate data analysis into their product functionality and core workflows.

Before you get started, you’ll need to have your data already loaded into Snowflake data platform. (If you’re interested in learning more about using Snowflake for data analytics, consider subscribing to our newsletter for free educational content.)

How do you build a high-performance data app with Snowflake as a Data Source?

To start building a data app inside Propel with Snowflake as your Data Source, you just need to complete these five easy steps:

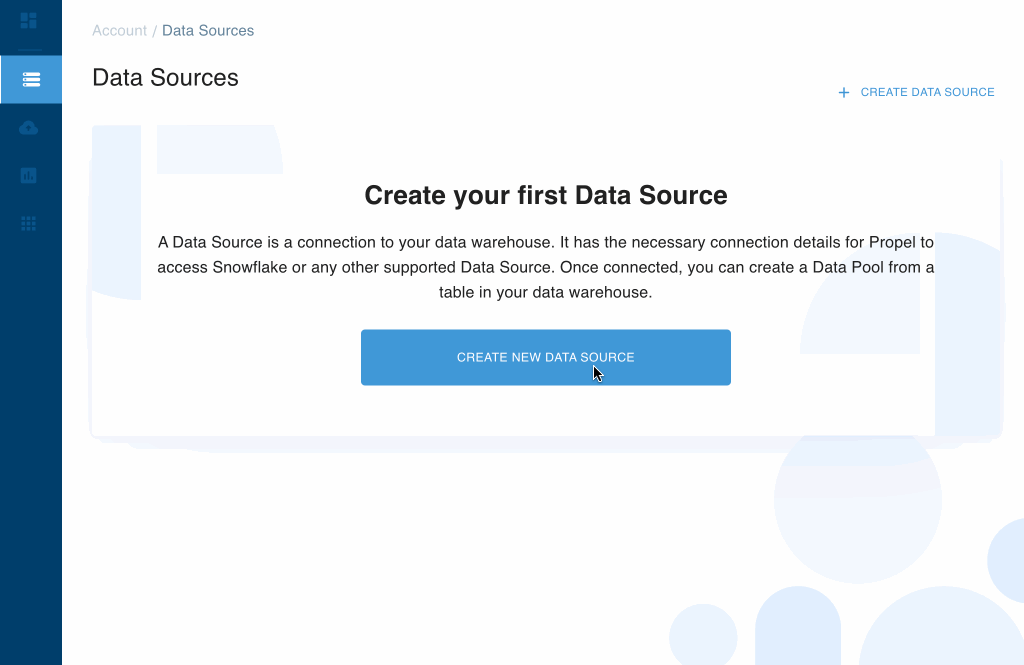
1. Connect to Snowflake data warehouse

First, you will need to create a user, role, and warehouse for Propel in your Snowflake account. (If you need a Propel account, join our waitlist, and we’ll onboard you as soon as we can!) Then, you can create the Snowflake Data Source inside Propel’s Console by entering your Snowflake connection details.

Propel will connect and run a series of checks to validate that the connection has the correct permissions.

An animated screen capture of the Propel Console, showing exactly how to create a Data Source and the numerous checks that confirm the connection is working.
An animated screen capture of the Propel Console, showing how to create a Data Source and the numerous checks that confirm the connection is working.

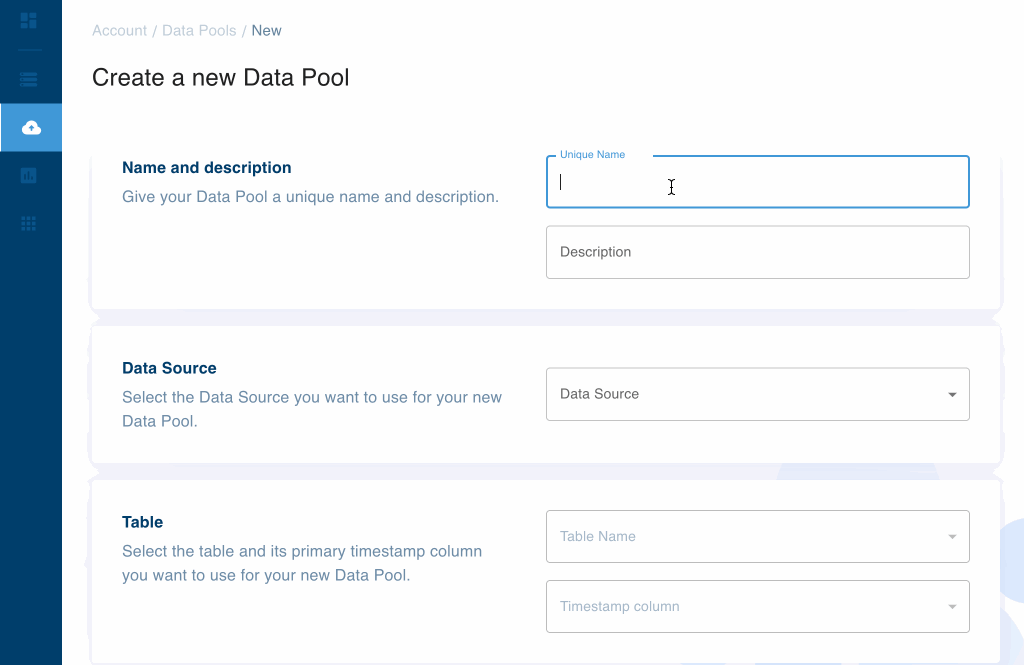
2. Sync a table from Snowflake

Once connected, you can operationalize a Snowflake table by creating a Data Pool inside Propel, which will start the sync process. When using Propel, a Data Pool automatically creates an optimized mirror of your table. There’s no need for any pipelines or data engineering.

While creating the Data Pool, you will need to indicate the table you want to operationalize and its primary timestamp column in the Console.

alt: An animated screen capture of the Propel Console, showing exactly how to create a Data Pool from a table within a Data Source.
An animated screen capture of the Propel Console, showing how to create a Data Pool from a table within a Data Source.

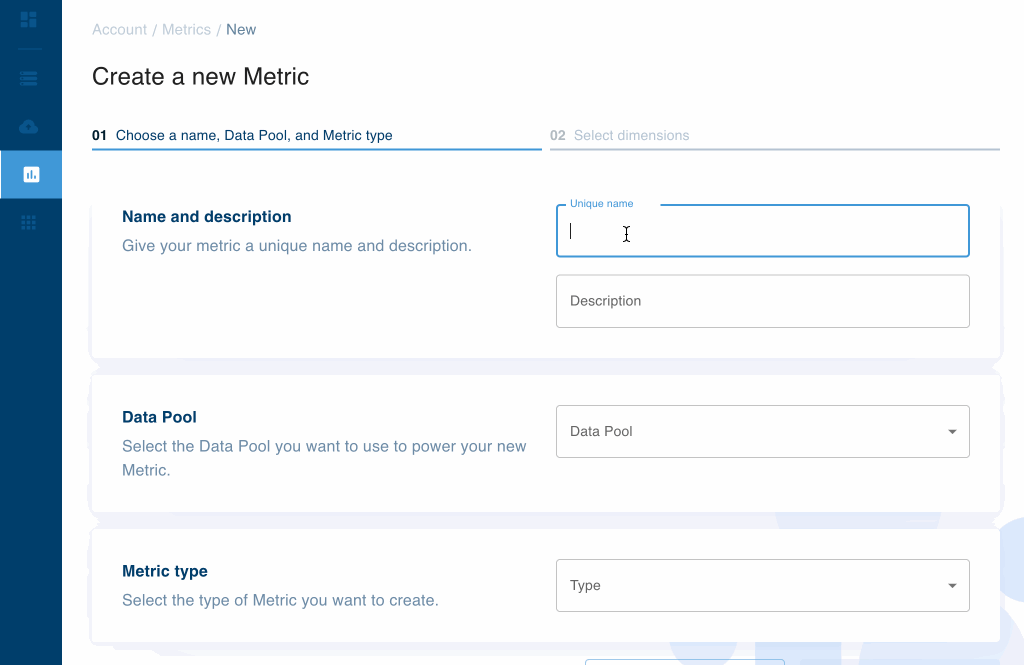
3. Define Metrics inside Propel

With your data operationalized, you can define the Metrics you want to use in your data app. Metrics are the analytics measures you want to track, and they can be of different types: SUM, COUNT, COUNT_DISTINCT, MIN, MAX, and AVERAGE.

Once you configure your Metric settings in Propel, you can select the columns you want to expose as Dimensions. Dimensions are the different ways you can filter Metric data to uncover insights. When defining a customer-facing Metric, you can control which columns are exposed to the public via Dimensions.

An animated screen capture of the Propel Console, showing exactly how to create a Metric from a Data Pool, how to choose the Metric type, and how to add Dimensions for filtering.
An animated screen capture of the Propel Console, showing how to create a Metric from a Data Pool, how to choose the Metric type, and how to add Dimensions for filtering.

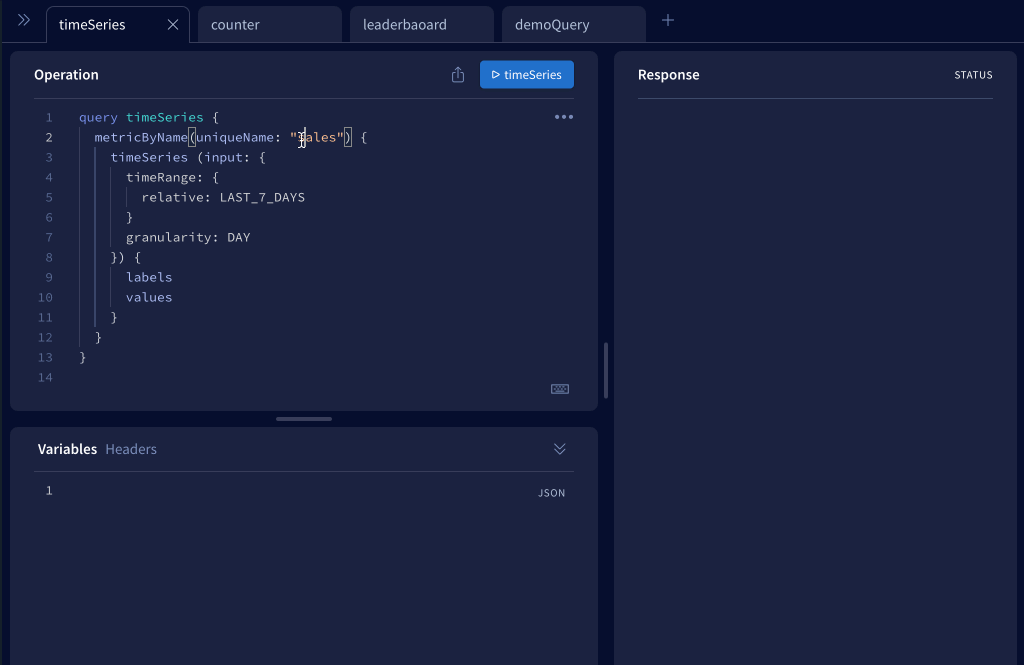
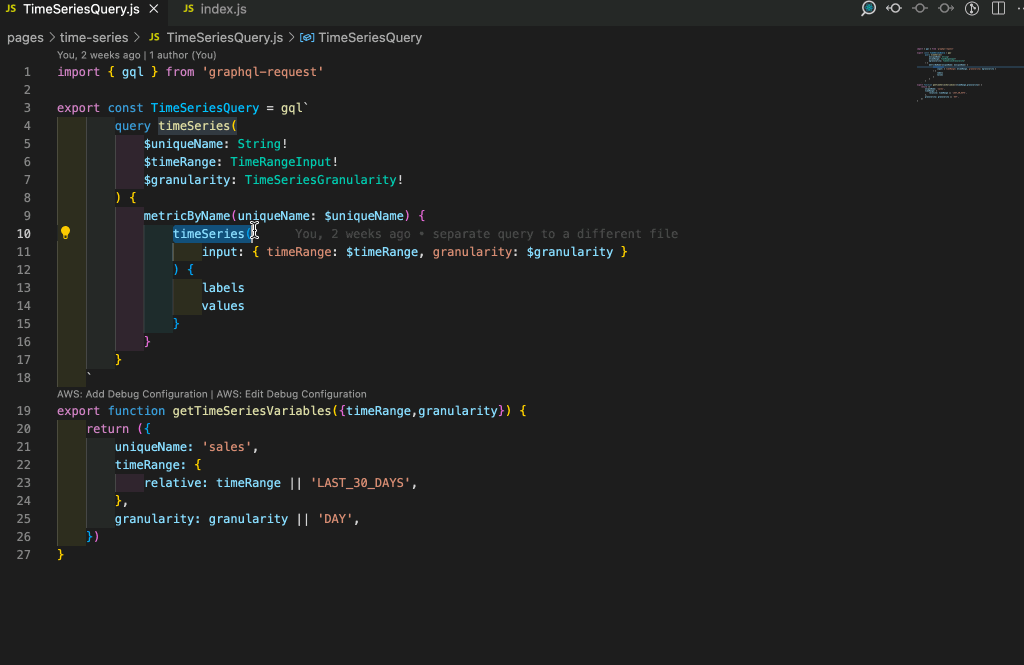
4. Query your Metrics using GraphQL

Propel gives you a GraphQL API that is always up and always performant in just a few easy steps. Once you have your Metric defined, you can try Propel’s GraphQL Explorer to query the Metric data in the format you are going to use: a Time Series, a Counter, or a Leaderboard.

Looking at the top-right of the GraphQL Explorer, you’ll notice the fast response times you get with Propel’s high-performance GraphQL API. In this example, the response time is about 500 milliseconds (end to end) when querying hundreds of thousands of records.

An animated screen capture of Propel’s GraphQL Explorer, showing exactly how to query a Metric using the GraphQL API with various time granularities and filters.
An animated screen capture of Propel’s GraphQL Explorer, showing how to query a Metric using the GraphQL API with various time granularities and filters.

5. Build in-product analytics using GraphQL

The Metric you defined previously is now available via the GraphQL API. Using the technology stack of your choice, you can build in-product analytics into your app. You didn’t have to do any data engineering, beyond loading your data to Snowflake.

An animated screen capture of Visual Studio Code, showing exactly how to use Propel’s GraphQL API, React, and ECharts to query and visualize Metric data from Snowflake.
An animated screen capture of Visual Studio Code, showing how to use Propel’s GraphQL API, React, and ECharts to query and visualize Metric data from Snowflake.

How do I get started building data apps with Propel and Snowflake?

Join our waitlist!

We are now onboarding Snowflake users first as fast as we can. We are excited to see what you build with Propel!

Check out our post on How to build a Snowflake API!

Follow Propel Data on Twitter @propeldatacloud or subscribe to our product updates.

Related posts

Build Blazing-Fast Data Lake APIs Using Amazon S3, Parquet, and Propel: From Setup to GraphQL Queries

This is some text inside of a div block.

Heading 1

Heading 2

Heading 3

Heading 4

Heading 5
Heading 6

Lorem ipsum dolor sit amet, consectetur adipiscing elit, sed do eiusmod tempor incididunt ut labore et dolore magna aliqua. Ut enim ad minim veniam, quis nostrud exercitation ullamco laboris nisi ut aliquip ex ea commodo consequat. Duis aute irure dolor in reprehenderit in voluptate velit esse cillum dolore eu fugiat nulla pariatur.

Block quote

Ordered list

  1. Item 1
  2. Item 2
  3. Item 3

Unordered list

  • Item A
  • Item B
  • Item C

Text link

Bold text

Emphasis

Superscript

Subscript

5-Minute demo: How to expose your Snowflake data via a blazing-fast GraphQL API

This is some text inside of a div block.

Heading 1

Heading 2

Heading 3

Heading 4

Heading 5
Heading 6

Lorem ipsum dolor sit amet, consectetur adipiscing elit, sed do eiusmod tempor incididunt ut labore et dolore magna aliqua. Ut enim ad minim veniam, quis nostrud exercitation ullamco laboris nisi ut aliquip ex ea commodo consequat. Duis aute irure dolor in reprehenderit in voluptate velit esse cillum dolore eu fugiat nulla pariatur.

Block quote

Ordered list

  1. Item 1
  2. Item 2
  3. Item 3

Unordered list

  • Item A
  • Item B
  • Item C

Text link

Bold text

Emphasis

Superscript

Subscript

Propel & GraphQXL: the missing language extension

This is some text inside of a div block.

Heading 1

Heading 2

Heading 3

Heading 4

Heading 5
Heading 6

Lorem ipsum dolor sit amet, consectetur adipiscing elit, sed do eiusmod tempor incididunt ut labore et dolore magna aliqua. Ut enim ad minim veniam, quis nostrud exercitation ullamco laboris nisi ut aliquip ex ea commodo consequat. Duis aute irure dolor in reprehenderit in voluptate velit esse cillum dolore eu fugiat nulla pariatur.

Block quote

Ordered list

  1. Item 1
  2. Item 2
  3. Item 3

Unordered list

  • Item A
  • Item B
  • Item C

Text link

Bold text

Emphasis

Superscript

Subscript

Start shipping today

Deliver the analytics your customers have been asking for.