Receive the latest product updates and resources to build customer-facing analytics for your products.
Starting at $25 / month
Get blazing-fast queries at any scale—without worrying about clusters, devOps, or uptime.


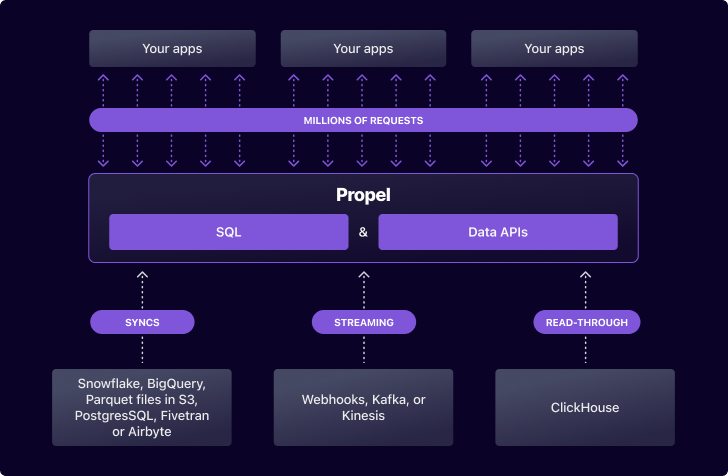
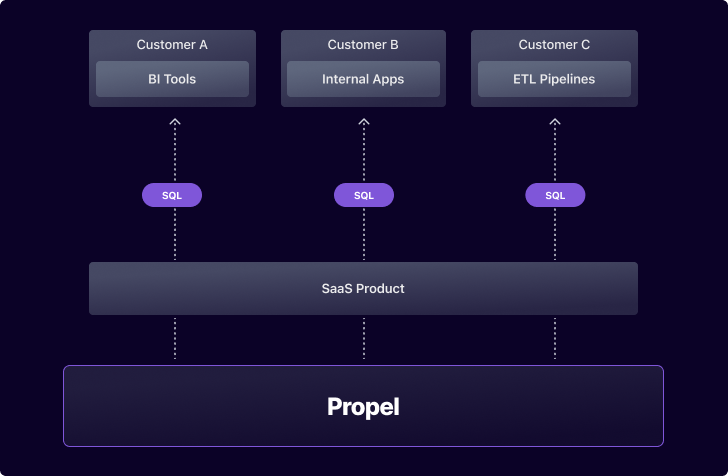
Power internal and customer-facing use cases with a single data platform.

The complete toolkit to ship the best analytics products on the planet.
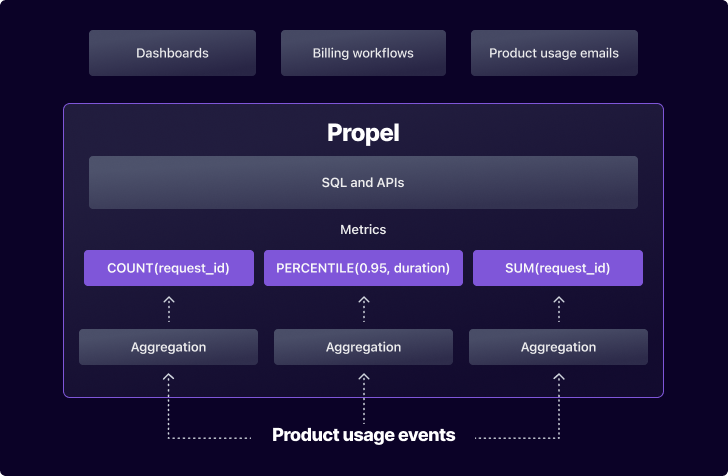
Unify and bring your batch and streaming together. It is as simple as connecting your data source or sending JSON events.


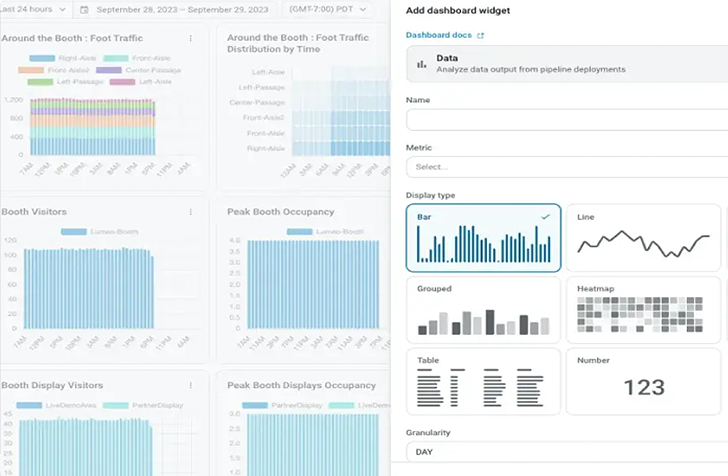
Use Propel's powerful Materialized Views tools to clean, join, format, aggregate, and enrich your data, preparing it for analysis in real time.

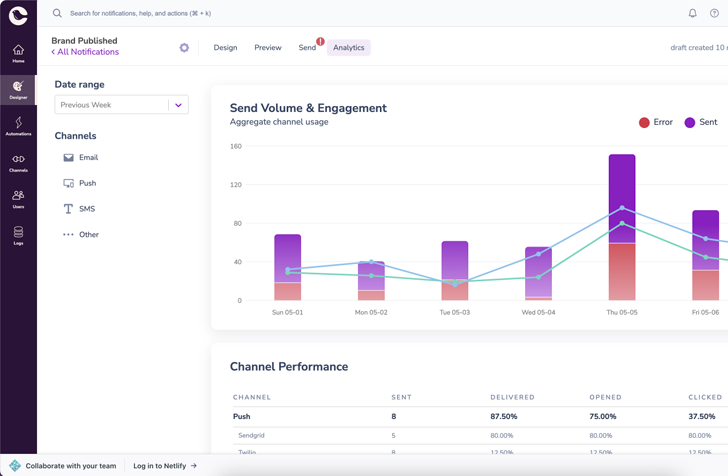
Define metrics from your data that represent key performance indicators for your product. These metrics can create insightful dashboards and reports for your customers.

Query using SQL through the API, React Query Hooks, or a PostgreSQL-compatible SQL connector. Our multi-tenant access policies ensure that end customers can only query their own data.
Integrate with any framework or programming language


Build data apps without backend dependencies with highly optimized data APIs for common access patterns.
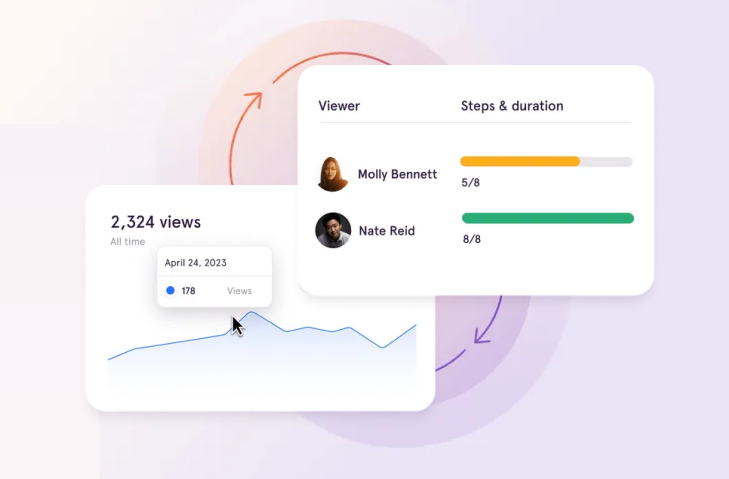
Simply add the <TimeSeries/>, <Counter/>, <Leaderboard/>, or <SimpleFilter/> React components for your dashboard functionality. Match it to your brand with any CSS library, then deploy it as part of your app — no more janky-looking embedded iframes!


No matter how you choose to deploy we have you covered


Connect directly with a Propel solutions architect to explore how Propel can support your team. Get a live product demo and learn how to maximize the benefits of Propel.
"I've had to own this in the past, and it's not cheap. With Propel, we launched our enterprise dashboards in a couple of sprints.”
Seth Carney
"My goal is to deliver meaningful business insights to our customers. Propel makes this an easy and scalable process."
Joe McCorkle
"Propel is the way to go. It enabled us to launch user-friendly yet robust analytics quickly and efficiently on a large scale.”
Kristie Howard
Visit the Trust Center to view more details on Propel’s security and compliance.
View the Trust Center


.png)


